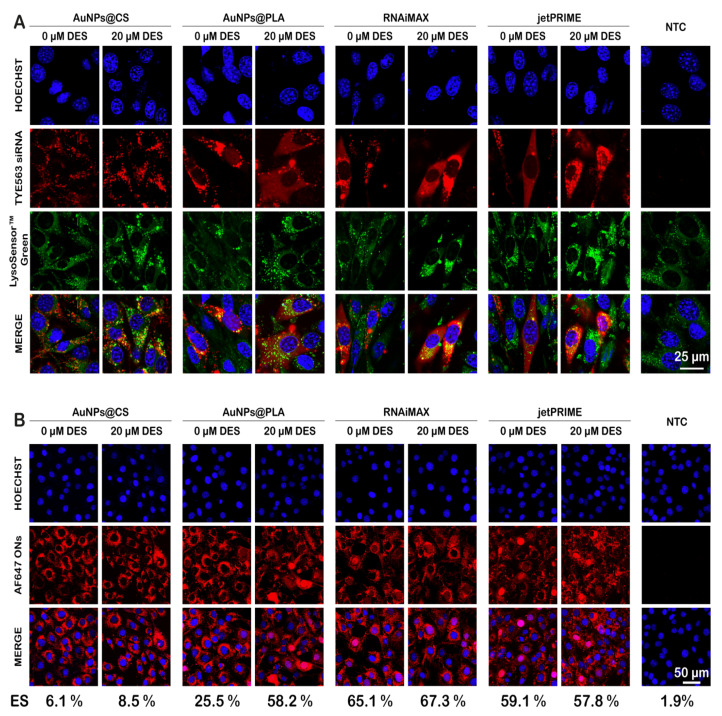
Figure 4.
Uptake and endosomal escape of nanoformulations alone or in combination with DES. (A) Representative confocal images of NIH-3T3 cells incubated 4 h with TYE563 siRNA-loaded nanoformulations (red), followed by 20 h incubation with cell medium with or without 20 μM DES. Hoechst-stained nuclei can be seen in blue, while late endosomes and lysosomes are stained with LysoSensorTM green. The scale bar corresponds to 25 μm. (B) Representative confocal images of NIH-3T3 cells, incubated 4 h with AF647 ON-loaded carriers, followed by 20 h incubation with cell medium with or without 20 μM DES. Hoechst-stained nuclei can be seen in blue, while cells in which endosomal escape happened have red fluorescent nuclei due to the release of AF647 ONs, which accumulate in the nucleus. The values below the images correspond to the percentage of cells with red nuclei (endosomal escape (ES)), as determined from at least 500 cells for each case. The scale bar corresponds to 50 μm.

