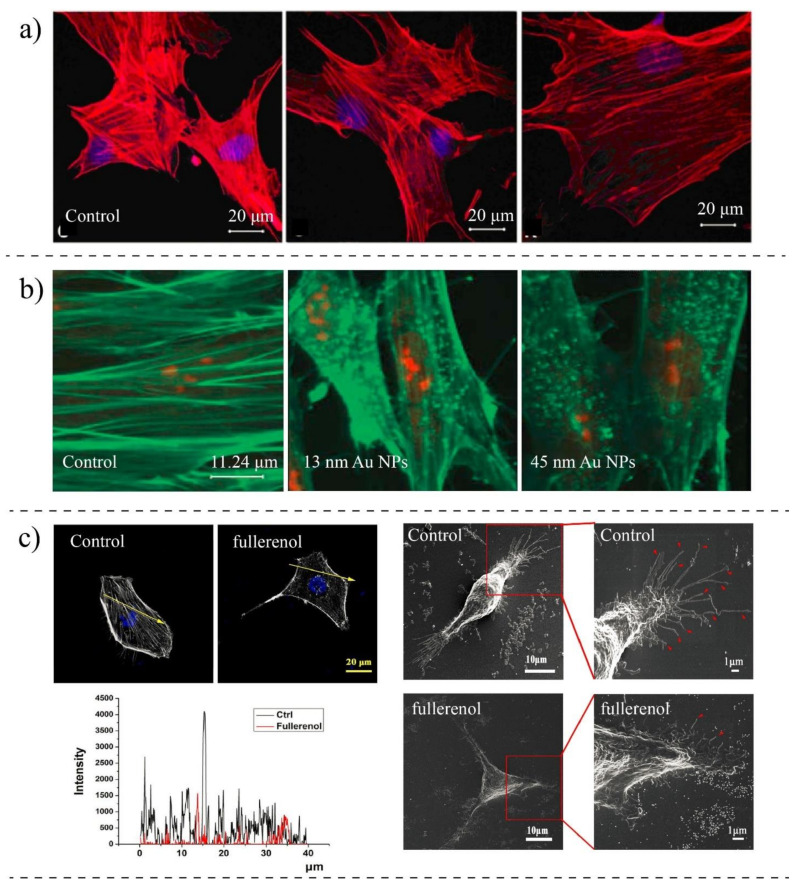
Figure 7.
(a) Mesenchymal stem cells treated with silica (Si) and silica–boron (SiB): F-actin detected with red TRITC-phalloidin staining, and DNA stained with blue DAPI. Actins in control cells are packed longitudinally, while they are arranged transversally in treated cells [148]. Copyright 2014, Open Access Springer Journals. (b) Fluorescent imaging of human dermal fibroblasts stained for F-actin after three days exposure to gold NPs. F-actins appeared to be in dotted format compared to control cells. Reprinted with permission from [37]. Copyright Informa UK Ltd. 2010. (c) SEM images of MDA-MB-231 cells treated with fullerenol NPs compared to control cells. Treated cells show shorter protrusions in comparison to control cells, and the concentration of actin fibers has reduced after the uptake of NPs [151]. Copyright 2019, Open Access, Journal of Nanobiotechnology.

