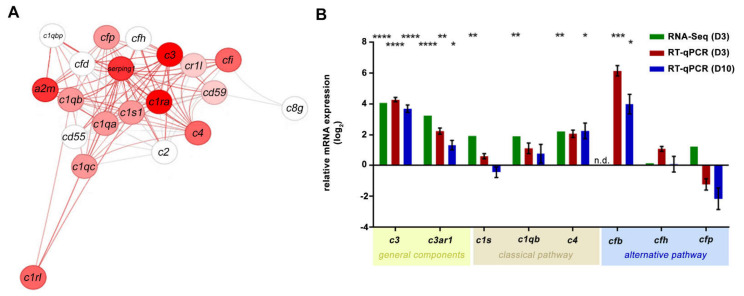
Figure 2.
Increase in the mRNA expression of the complement components in the retina following NaIO3 treatment. (A) The transcript quantity of the components of the complement pathway (GO: 0006956) was changed in the retinas after the NaIO3 treatment at day 3. Nodes are the genes with their connections as defined in STRING database version 10, and the colour is given by the fold change (log2FC = 4) of the regulation (red = up, white = no regulation). (B) The fold change (log2) mRNA expression levels of the general (c3 and c3ar1), classical (c1s and c4) and alternative (cfb) pathway components were analysed in independent experiments using either RNA-seq or RT-qPCR. The retinal tissue was harvested at day 3 (RNA-seq analysis, n = 5) or day 3 and day 10 (RT-qPCR, n = 6) after NaIO3 application. RNA-seq gene expression was normalised to the overall gene set. The RT-qPCR expression was normalised to the idh3b reference mRNA. Fold change in the expression (compared to the untreated control, line at y = 0) was calculated on the logarithm to base 2. The gene expressions of treated versus untreated retinas were evaluated using ordinary one-way ANOVA and Tukey’s multiple comparisons test (* 0.01 < p < 0.05, ** 0.001 < p < 0.01, *** 0.0001 < p < 0.001 and **** p < 0.0001).

