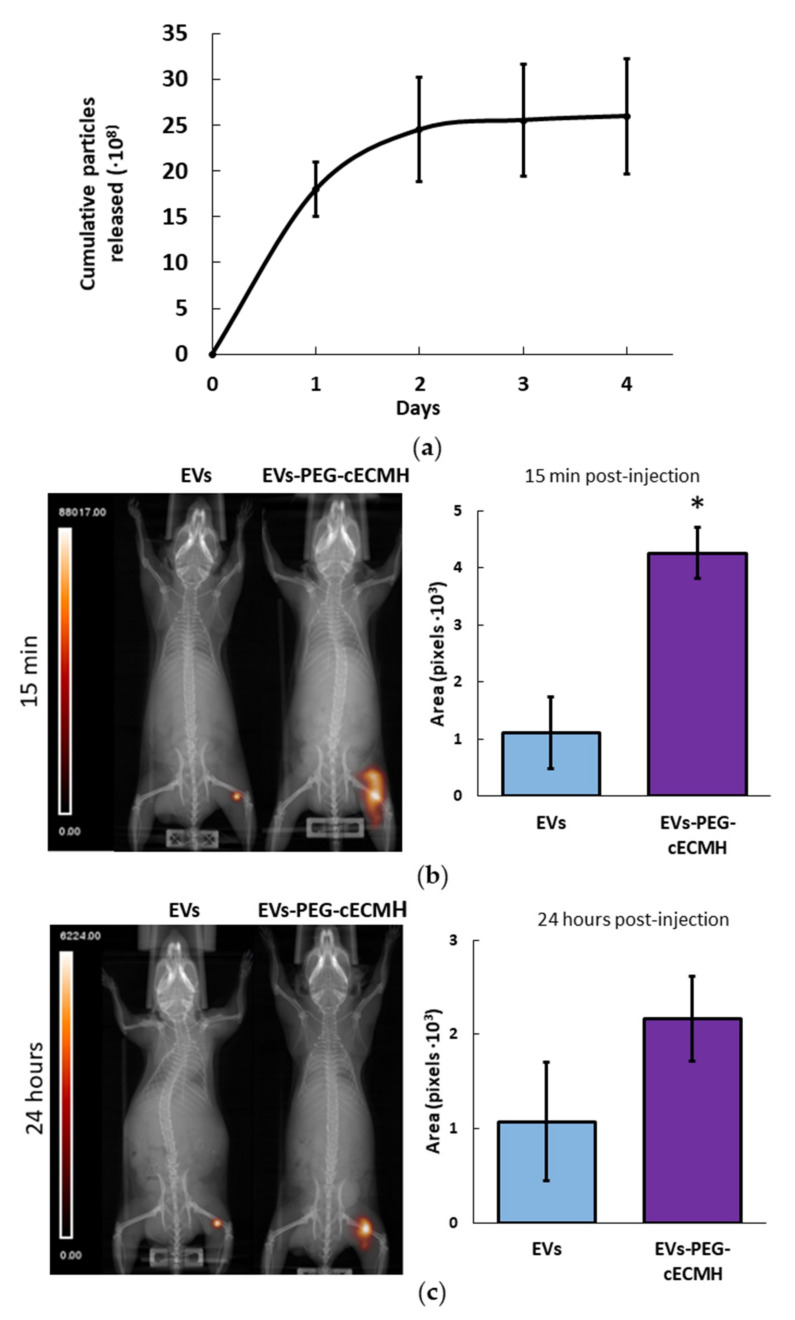
Figure 5.
EV release from the EVs–PEG–cECMH and EV in vivo retention. (a) Number of cumulative EVs released into the medium from EVs–PEG–cECMH for 4 days (n = 3, each run in triplicate), evaluated using nanoparticle tracking analysis (NTA). The error bars were obtained by the standard deviation of the three different samples. After 48 h there were no significant differences (p > 0.05) with the number of particles detected in control samples. (b) Representative single-photon emission computed tomography–computed tomography (SPECT–CT) images and area of radioactively labeled EVs (n = 3) after in vivo injection of EVs resuspended in phosphate buffered saline (PBS) or in PEG–cECM (EVs–PEG–cECM) 15 min and (c) 24 h post-injection. * p < 0.05. cECMH, cardiac extracellular matrix hydrogel; PEG, polyethylene glycol; EVs, extracellular vesicles.

