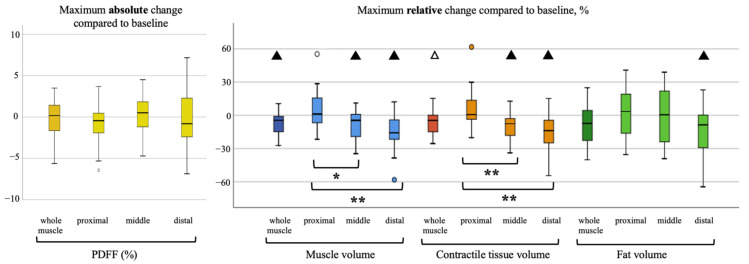
Figure 4.
Visualization of absolute maximum change of M. erector spinae PDFF on the left, relative maximum change of muscle volume, contractile tissue volume and fat volume per proximal, middle and distal muscle section on the right. Statistical significance of change tested with one-sample t-test (compared to no change with test value = 0), △= <0.05, ▲= <0.01. Statistical significance of change differing between muscle sections tested with one-way ANOVA analysis, * = <0.05, ** = <0.01.

