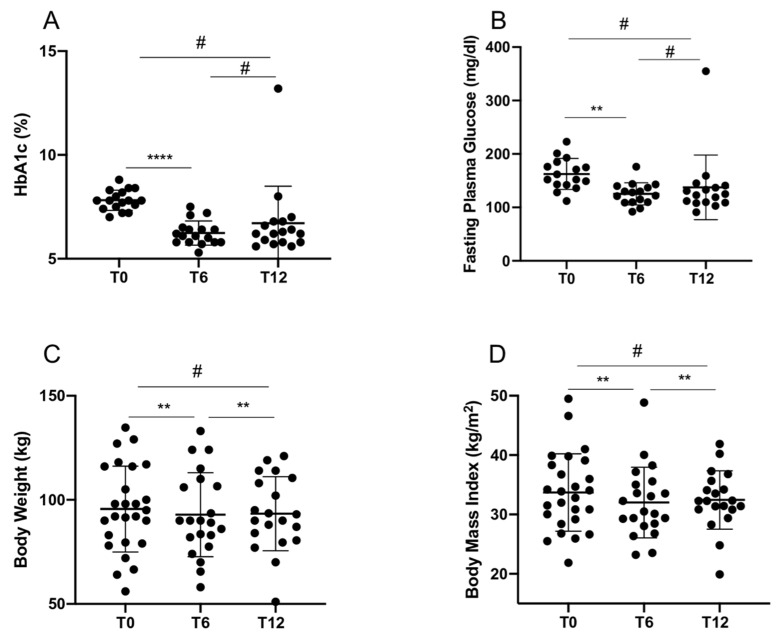
Figure 1.
Comparison of HbA1c values (A), fasting plasma glucose (B), body weight (C) and body mass index (D) between baseline (T0) and after 6 (T6) and 12 (T12) months of treatment. Statistics using repeated measures one-way ANOVA with Tukey’s multiple test. # p not significant; **** p < 0.0001; ** p < 0.01.

