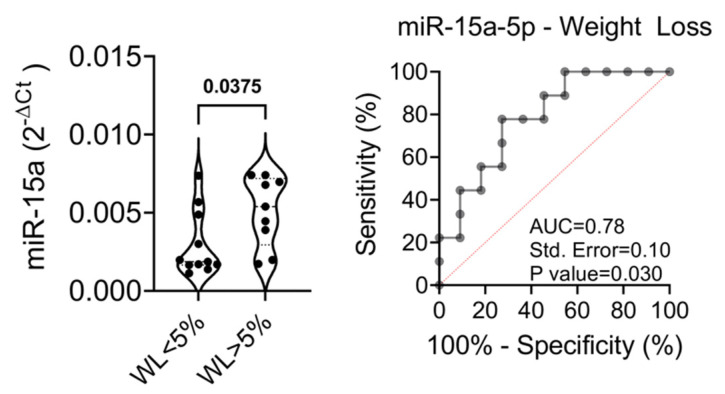
Figure 5.
(Left) Baseline expression (T0) of miR-15a-5p in patient with WL <5% or >5% at T12. Data are reported as single dot values and mean values of normalized 2−ΔCt. Statistics using non-parametric Mann-Whitney U test. FPG: fasting plasma glucose; WL: weight loss. (Right) ROC curve of miR-15a-5p baseline expression levels in the prediction of weight loss outcome at 12 months.

