Figure 6.
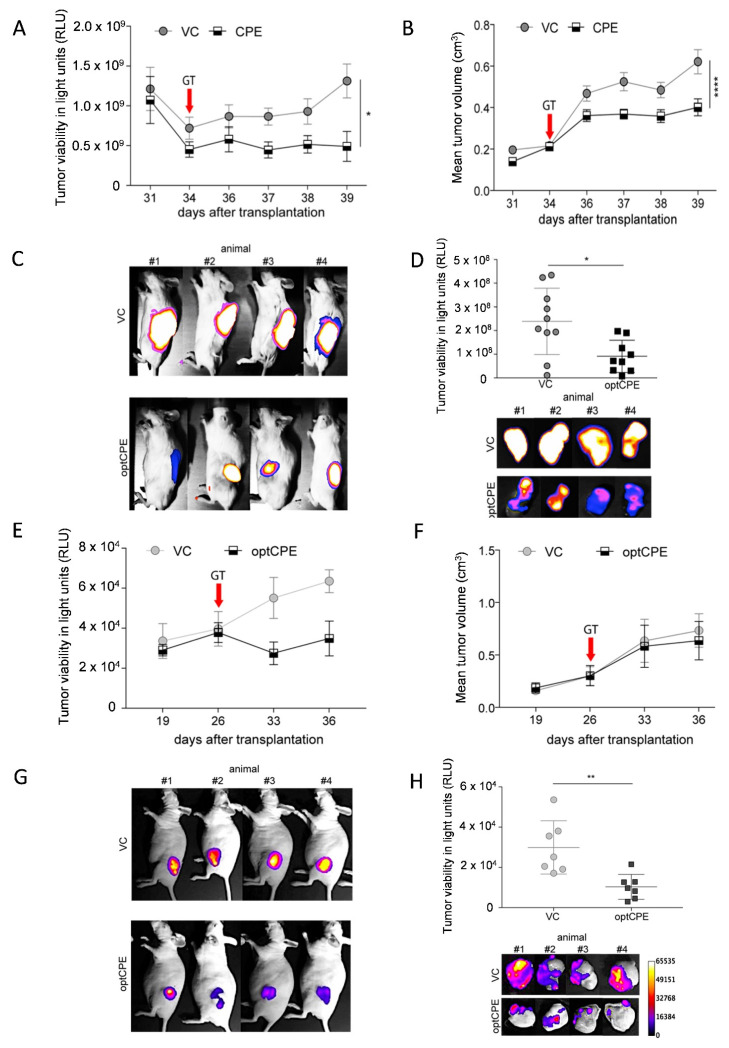
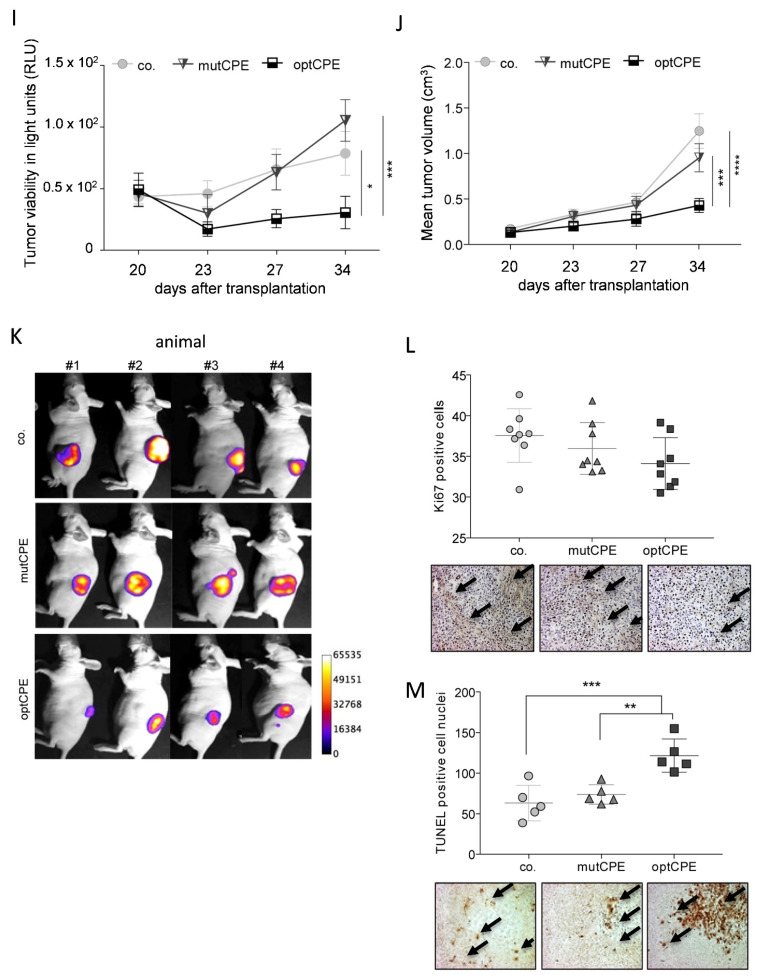
Therapeutic efficacy of non-viral in vivo optCPE gene transfer. (A) 34 days after cell injection of optCPE gene transfer (GT) was performed. By this, significant inhibition of tumor viability (determined by bioluminescence; BL), and (B) tumor growth (measured via mean tumor volume) was observed in MIA PaCa-2/eGFP-Luc bearing mice compared to VC-transfected animals. (C) Decrease of BL in optCPE-transfected tumors compared to controls, shown in representative images. (D) Ex vivo tumor BL showed significantly reduced tumor viability at day 39. Data represent mean values ± S.E.M. (n = 10). (E) Reduction of tumor viability of Capan-1/eGFP-Luc CDX tumors (determined by tumor BLI) was observed after intratumoral optCPE gene transfer (performed 26 days after cell injection). (F) Mean tumor volume was not affected by intratumoral optCPE expression. (G) Decrease of BL in optCPE-transfected CDX tumors compared to respective vector control (VC), shown by representative images. (H) At day 36 ex vivo tumor BL was determined (n = 7), showing significantly reduced viability. (I) After intratumoral optCPE gene transfer (performed 23 days after tumor cell injection), significant antitumoral efficacy was shown in PA-TU-8902/eGFP-Luc CDX-bearing mice. Tumor viability (determined by tumor BL) decreased significantly in optCPE-expressing tumors compared to empty vector control (VC) or the non-Cldn3/4 binding CPE (mutCPE) expressing tumors. (J) Similarly, in vivo optCPE gene transfer significantly inhibited of PA-TU-8902/eGFP-Luc CDX tumor growth compared to VC or mutCPE gene transfer, respectively. (K) Tumor BL revealed reduced tumor viability by reduction of BL signals in optCPE-transfected CDX tumors compared to respective controls, shown in representative images. (L) Ki67 analysis (brown staining, indicated by arrows) shows decrease in optCPE-transfected groups (not significant). (M) In optCPE-transfected PA-TU-8902/eGFP-Luc CDX tumors TUNEL assay shows significantly increased number of TUNEL positive nuclei (brown staining, indicated by arrows) compared to mutCPE or VC-transfected tumors. All data represent mean values ± S.E.M. (n = 8). The level of significance was determined using One way ANOVA based on one characteristic or factor (different treatments) or Two way-ANOVA based on multiple characteristics (e.g., different treatments at different time points) and Turkey’s multiple comparison post-test or the nonparametric Mann-Whitney U-test based on comparison of two groups. (n.s. not significant; * p < 0.05; ** p < 0.01; *** p < 0.001; **** p = 0.0001).


