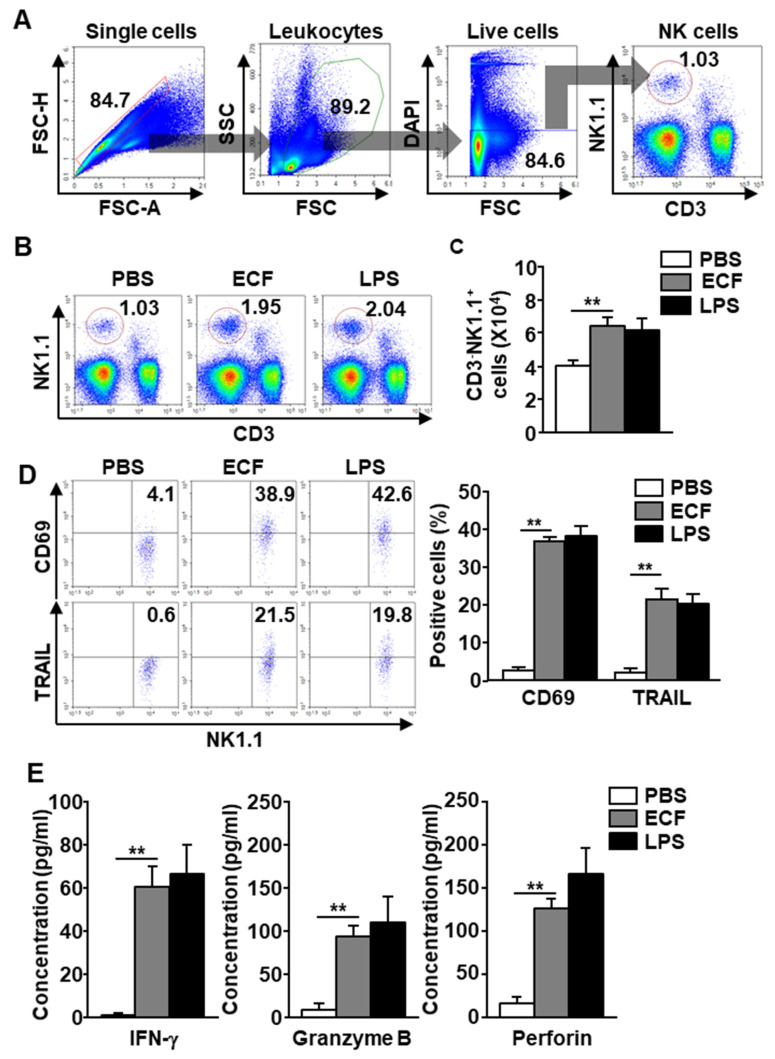
Figure 2.
Natural killer (NK) cell activation by ECF. Twenty-four hours after 50 mg/kg ECF administration intranasally, the mLN was harvested from C57BL/6 mice. (A) NK cells definition was shown. (B) The percentage of NK cells was shown. PBS, phosphate-buffered saline; LPS, lipopolysaccharide. (C) Average of NK cell number in the mLN (n = 6, two-way analysis of variance, ** p < 0.01). (D) Surface activation markers, CD69 and tumor necrosis factor-related apoptosis-inducing ligand (TRAIL) expression levels in mLN NK cells were shown (left panel). Mean number of CD69 and TRAIL positive cells in mLN NK cells were shown (right panel, n = 6, two-way analysis of variance, ** p < 0.01). (E) Concentration of interferon (IFN)-γ, granzyme B, and perforin levels in BAL fluid was shown. (n = 6, two-way analysis of variance, ** p < 0.01).

