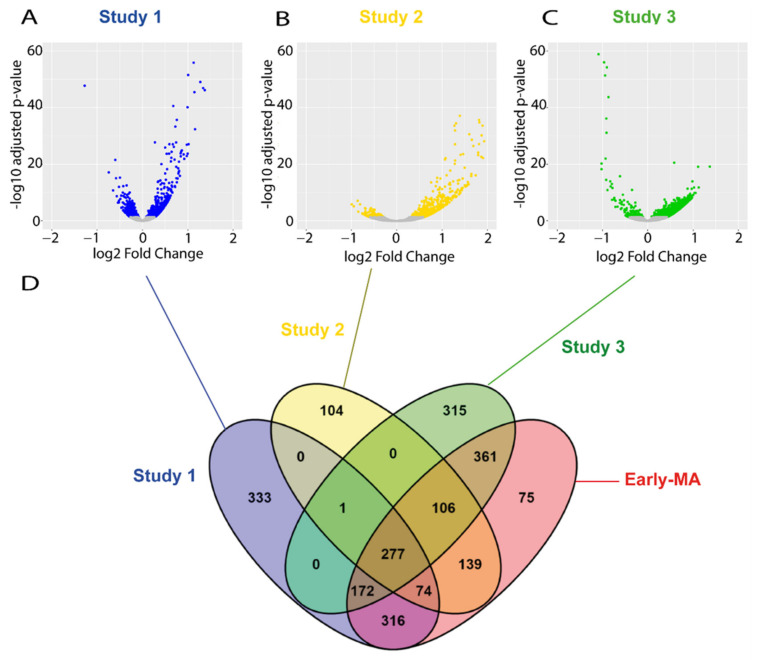
Figure 3.
Meta-analysis of early symptomatic RNA-seq studies. (A–C) Volcano-plots showing the dysregulated genes found on each of the three RNA-seq studies selected at P90. Blue, yellow, and green dots indicate DEGs found in the study 1, 2, and 3, respectively. Grey dots indicate genes with no significant change. (D) A Venn diagram illustrating the overlapping DEGs across the three studies and the result of the meta-analysis (Early MA). The meta-analysis (Early MA) was performed using Fishers combined probability test where raw p-values were adjusted by the Benjamini–Hochberg false discovery rate (FDR) method and the adjusted p-values less than 0.01 were considered as statistically significant.

