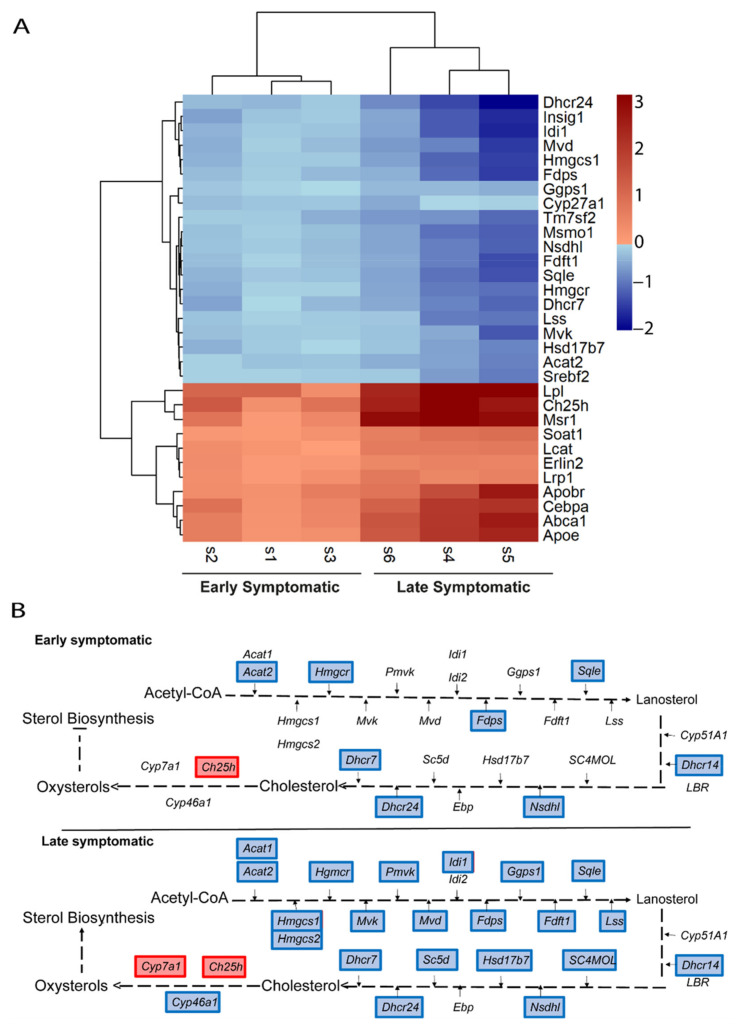
Figure 6.
Comparative transcriptional alterations in cholesterol metabolic pathways in the spinal cord of SOD1 mice at early and late symptomatic disease stages. (A) A heatmap of the combination of the six studies (three early symptomatic and three late symptomatic) showing the expression level of the altered genes that participate in cholesterol metabolic pathways. The heatmap colours indicate the expression levels by the log2-fold-change. Each column represents an individual RNA-seq study, and each row represents one gene. (B) The cholesterol biosynthesis and transport pathways are represented, comparing the results from the Early MA and the Late MA. Coloured genes indicate that the gene was significantly altered in the meta-analysis. Blue indicates downregulation and red indicates upregulation.

