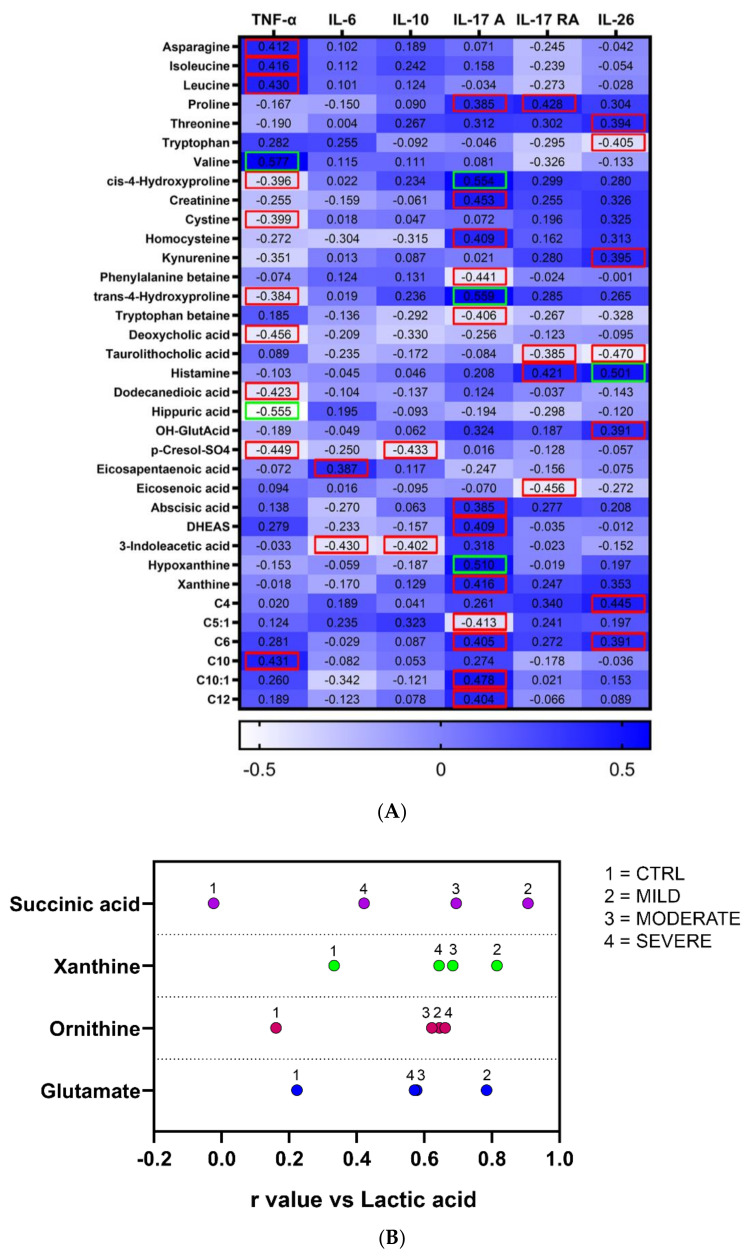
Figure 5.
Correlation analysis of the metabolites with inflammatory cytokines and between the metabolites. (A) The analysis was performed correlating the concentrations of the metabolites with cytokine parameters in COVID-19 patients. Only metabolites with at least one significant association with cytokines were reported. Dark blue cells denote positive association, while light blue cells denote negative association. Squared numbers refer to significant positive or negative association, with red and green squares indicating p < 0.05 and p < 0.01, respectively. (B) Significant metabolites positively correlating with lactic acid levels in mild, moderate, and severe patients. For each metabolite found statistically significant, a numbered dot corresponding to a given disease group is aligned with the r value of correlation with lactic acid on the x-axis.

