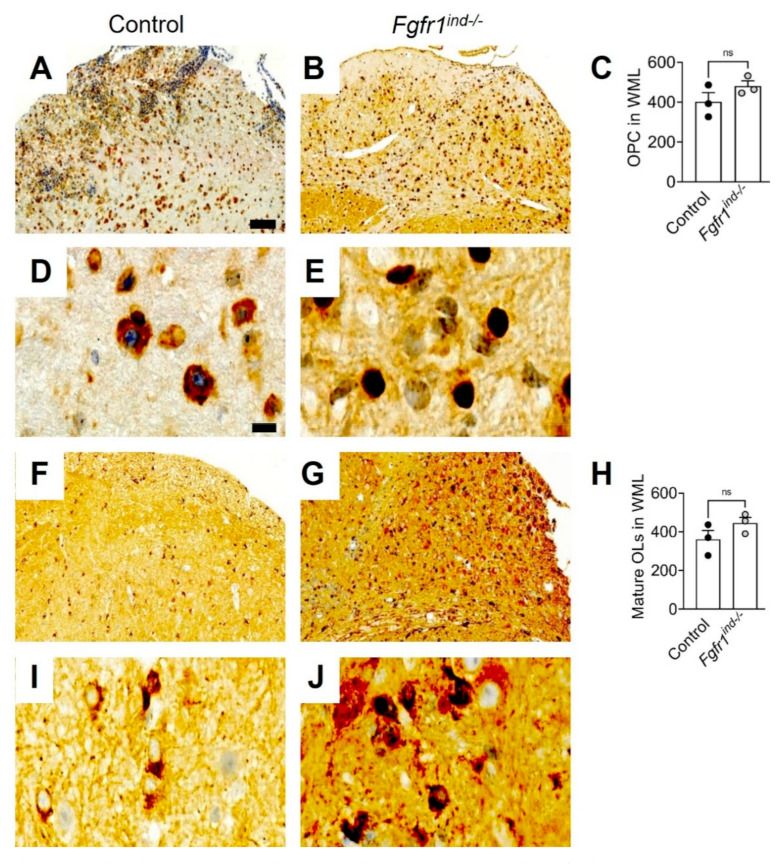
Figure 4.
Oligodendrocyte populations at day 62 p.i. The number of Olig2(+) and NogoA(+) oligodendrocytes in WML of the cerebellum for controls (A,D,F,I) and Fgfr1ind−/− mice (B,E,G,J). There were no differences in Olig2(+) (A–E) and NogoA(+) (F–H) oligodendrocyte numbers between controls and Fgfr1ind−/− mice. (D,E,I,J) were magnified views of (A,B,F,G). n = 3/group. Scale bar depicts 50 μm (C,D). Data are expressed as the mean ± SEM. ns = not significant.

