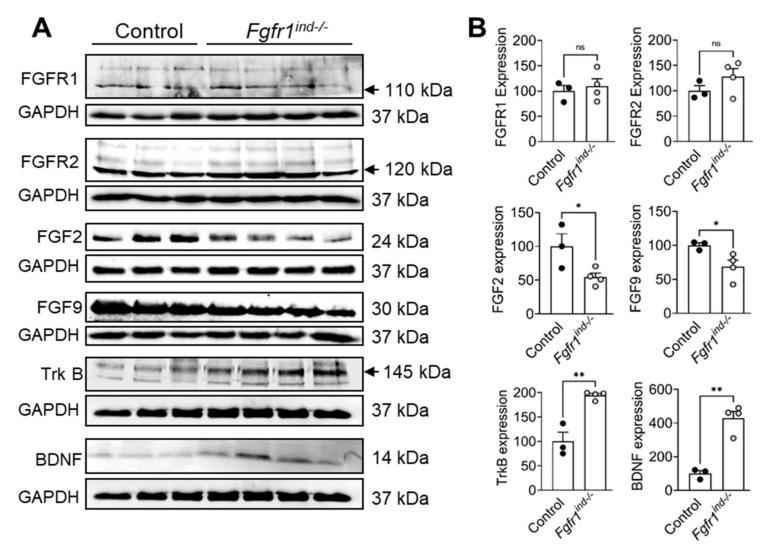
Figure 6.
FGF/FGFR1 signaling and BDNF/TrkB expression in the cerebellum at day 62 p.i. FGFR1 and FGFR2 protein expression was not different between Fgfr1ind−/− mice and controls. The FGFR ligands FGF2 and FGF9 were decreased in Fgfr1ind−/− mice. BDNF and TrkB protein expression was increased in Fgfr1ind−/− mice (A,B). n = 3–4/group. Data are expressed as the mean ± SEM. ns = not significant, * p < 0.05, ** p < 0.01.

