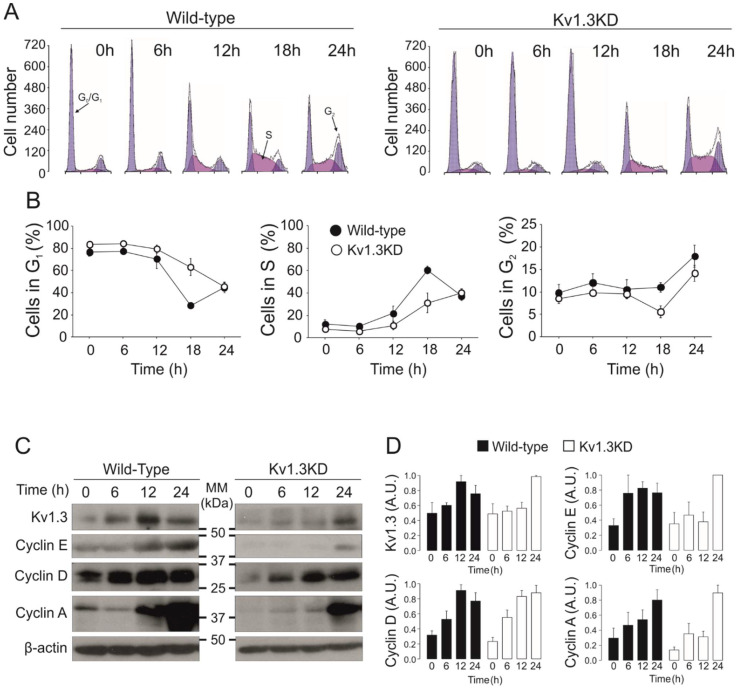
Figure 2.
Kv1.3 facilitates the G1/S transition of the cell cycle in preadipocytes. Serum-starved resting cells were incubated for the indicated time after serum readdition. (A) Cell cycle analysis of 3T3-L1 preadipocytes was performed with propidium iodide. Representative histograms at 0, 6, 12, 18 or 24 h after serum readdition. The cells exhibit two blue peaks corresponding to the G0/G1 (left) and G2 (right) phases. The cell population in purple corresponds to cells in the S phase. Left panels, wild-type preadipocytes; right panels, Kv1.3KD preadipocytes. (B) The % of cells in the G0/G1 phase, % of cells in the S phase and % of cells in the G2 phase for wild-type (black) and Kv1.3KD (white) preadipocytes. The data are the mean ± SE (n = 4–10 independent experiments). Two-way ANOVA indicated p < 0.001 in the G0/G1 phase and p < 0.01 in the S phase between wild-type and Kv1.3KD preadipocytes. (C) protein expression of Kv1.3, cyclin E, cyclin D1 and cyclin A. (D) Relative protein expression from the data in C. The values were relative to 0 h for each condition and normalized to the level of β-actin, which was used as a loading control (wild-type, black columns; Kv1.3KD, white columns). The data are the mean ± SE (n ≥ 3). p < 0.05 between WT and Kv1.3KD at 12 h in Kv1.3 and cyclin E (Student’s t test).

