Figure 3.
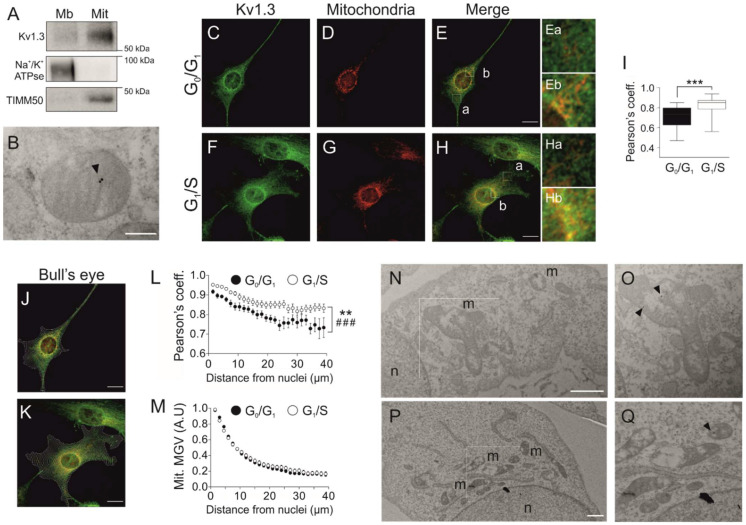
Kv1.3 accumulates at perinuclear mitochondria during the G1/S transition. (A) Subcellular fractionation of 3T3-L1 wild-type preadipocytes to obtain the membranous (Mb) and mitochondrial (Mit) fractions. The samples were probed for Kv1.3, Na+/K+ ATPase (a membrane marker) and TIMM50 (a mitochondrial marker). (B) Electron micrograph showing mitochondria of 3T3-L1 wild-type preadipocytes. Kv1.3 was labeled with 18 nm immunogold particles (black arrowhead) and was located at the inner mitochondrial membrane. The scale bar represents 200 nm. (C–H) Cells were either in the G0/G1 or the G1/S phase following serum deprivation or serum readdition for 12 h, respectively. Representative confocal images showing Kv1.3 and mitochondria in wild-type preadipocytes fixed in the G0/G1 (C–E) and G1/S (F–H) phase. Ea-Eb and Ha-Hb are magnified images of E and H, respectively. Ea and Ha show distal regions, and Eb and Hb show perinuclear regions. Yellow indicates colocalization of Kv1.3 (green) and mitochondria (red). The scale bar represents 20 µm. (I) Pearson’s coefficient of colocalization between Kv1.3 and mitochondria. The data are the mean ± SE (n > 30). *** p < 0.001. (J,K) Bull’s eye analysis of the images in panels C–E and F–H. Equally spaced concentric rings of the shape of the nucleus covering the whole cell were automatically drawn. Yellow indicates colocalization between Kv1.3 (green) and mitochondria (red). (L) Analysis of Kv1.3 and mitochondrial colocalization. Pearson’s coefficient was measured for each ring and plotted against the distance from the nucleus. The data are the mean ± SE (n > 30 cells). ** p < 0.01 (G0/G1 vs. G1/S); ###, p < 0.001 (vs. distance from the nucleus) (two-way ANOVA). (M) Analysis of mitochondrial perinuclear distribution. The mean gray value (MGV) of the mitochondrial marker was measured for each ring and plotted against the distance from the nucleus. The data are the mean ± SE (n > 60). (N–Q) Electron micrographs of cells show Kv1.3 labeled with 18 nm immunogold particles (black arrowheads). The square insets are magnified images of O and Q. n, nuclei. m, mitochondria. The scale bar represents 1 µm.

