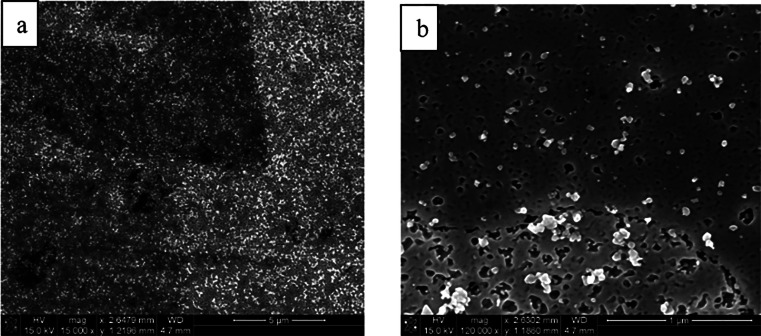
Figure 4.
Gold cathode after operation at −10 V (vs RHE) in an aqueous electrolyte containing 1 M Na+ showing differing corrosion rates depending on crystal orientations (left, a), and different surface concentrations of gold nanoparticles (right, b). Reproduced, with permission from ref (75). Copyright 2011 Wiley-VCH.

