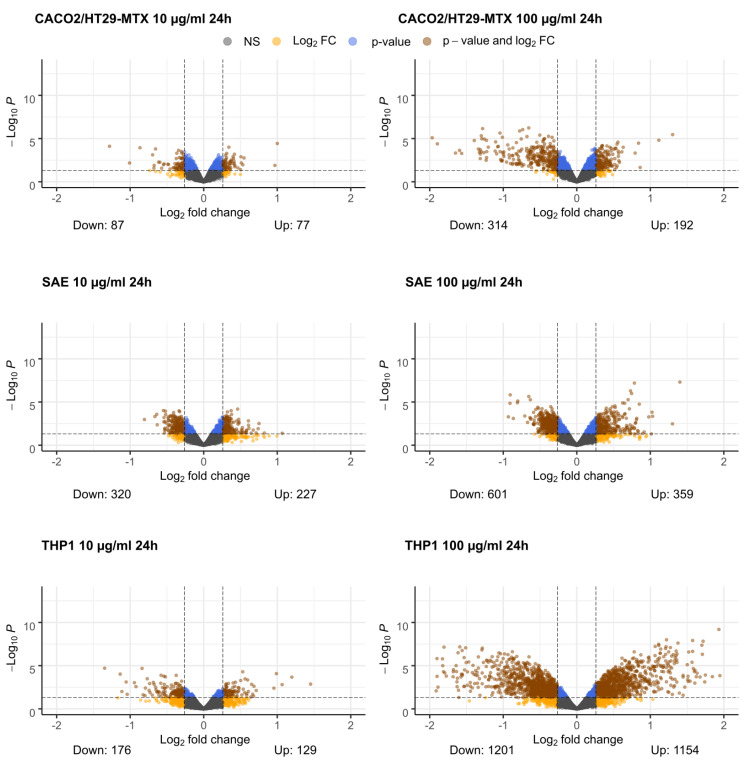
Figure 1.
Gene expression volcano plots for different cellular models and TiO2-nanobelt concentrations. On the x-axis log2 (fold change) is depicted whereas on the y-axis the -log10 (p-value) is depicted. The dotted lines represent cut-off values for significantly changed genes (log2 fold change > 0.26 or <−0.26, p-value < 0.05). A brown color depicts that a gene meets both cut-off criteria, a blue color relates to meeting only the p-value cut-off, an orange color relates to meeting only the log fold change cut-off, and a gray color indicates that a gene does not meet any of the criteria.

