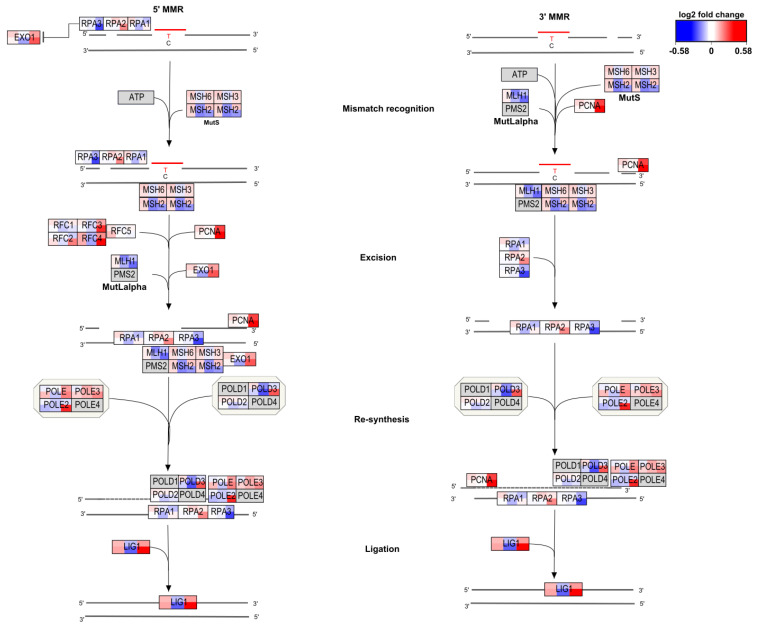
Figure A3.
Visualization of log fold change on the DNA Mismatch Repair pathway (wikipathways:WP531) for all six conditions. Cellular models are depicted from left to right as Caco-2/HT29-MTX, SAE, and THP1. The top row depicts the low concentrations whereas the bottom row depicts the high concentrations. Color gradient for differential gene expression after exposure goes from blue (downregulated) via white (not changed) to red (upregulated).

