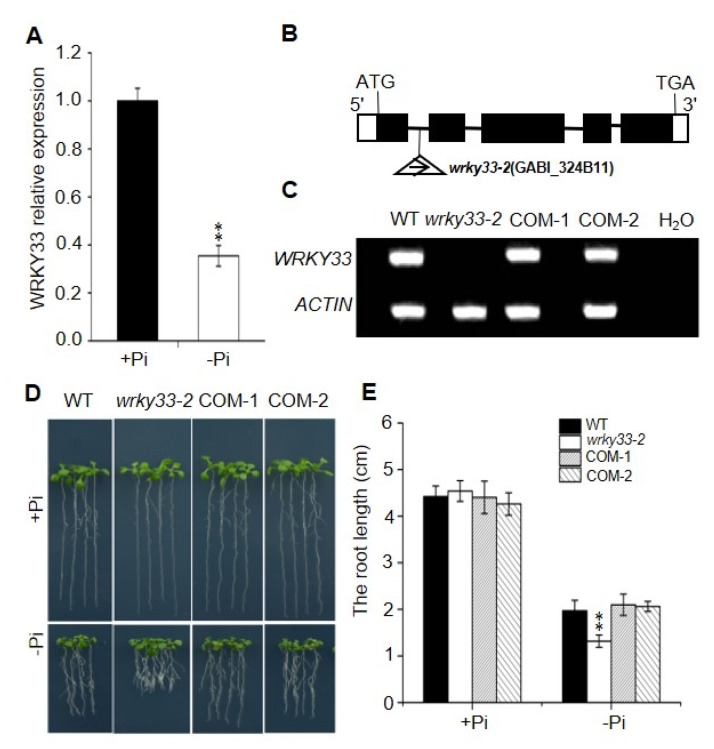
Figure 1.
WRKY33 mediated the Pi-deficiency-induced root growth inhibition. (A) Quantitative reverse transcription polymerase chain reaction (qRT-PCR) analysis of WRKY33 expression level. Four-day-old wild-type (WT) plants were transferred to Pi-sufficient (+Pi) or Pi-deficienct (−Pi) medium for 2 days. The WRKY33 expression under Pi-sufficient (+Pi) was set as 1.0, and the Pi-deficiency treatment level was normalized to the Pi-sufficient (+Pi) level. Data are mean ± SD from three replicate experiments. (B) Schematic map of T-DNA insertion location of wrky33-2 mutant. Black boxes, lines, and triangles represent exons, introns, and the position of the T-DNA insertion, respectively. The while boxes indicate the 5′ or 3′ UTRs. (C) RT-PCR analysis of the transcriptional level of WRKY33 in WT, wrky33-2, and complementation lines (COM-1, COM-2). Water was used as a negative control. (D) Growth phenotypes of WT, wrky33-2, COM-1, and COM-2. Four-day-old seedings were transferred to a Pi-sufficient (+Pi) or a Pi-deficient (−Pi) medium for six days. (E) The statistical analysis of the primary root length as indicated in (D). Data are means ± SD from three independent experiments (n = 15; n represents the number of samples). Asterisks in (A,E) indicate a significant difference from the WT (Tukey’s test; **, p < 0.01).

