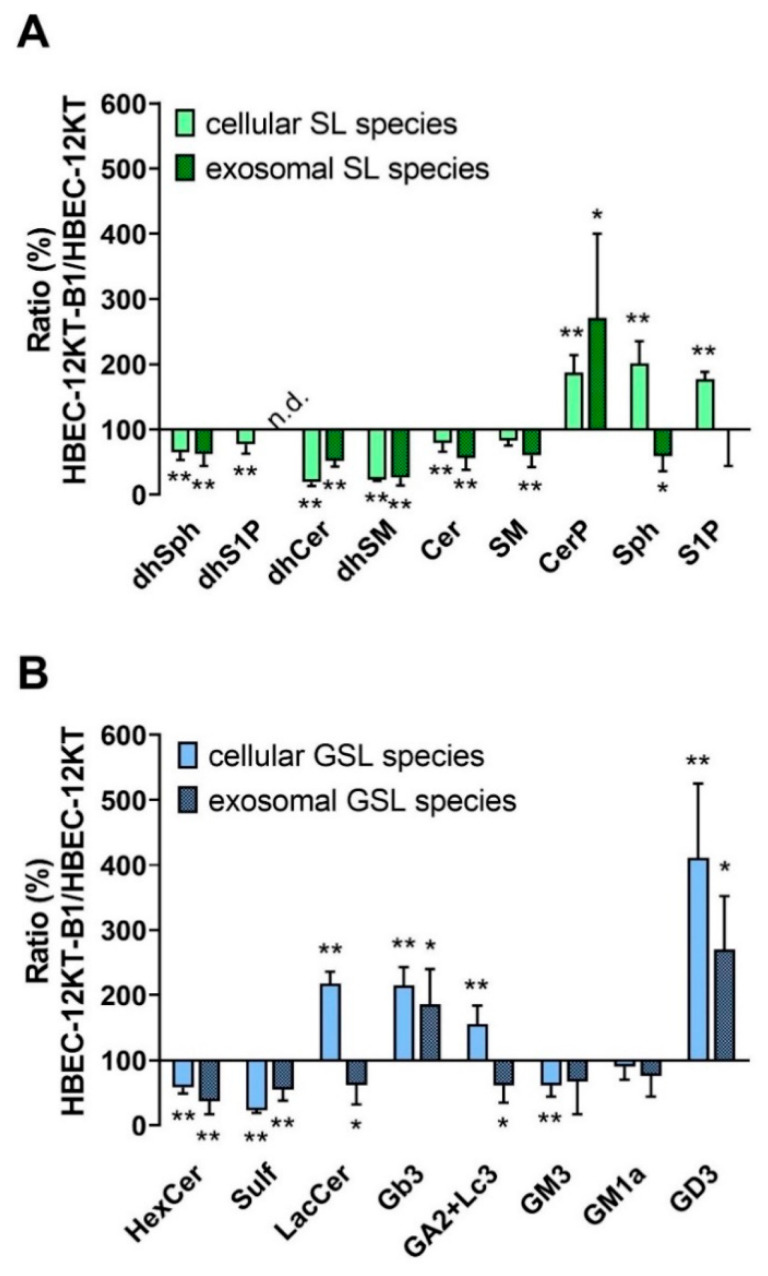
Figure 2.
Relative concentration of SL and GSL species in BaP-transformed HBEC-12KT-B1 cells vs. parental HBEC-12KT cells, as compared with their content in isolated exosomes. (A) Sum of SL species in cells and exosomes; (B) sum of GSL species. The cells and isolated exosomes were fixed in methanol, extracted, and analyzed with LC-MS/MS, as described in the material and methods. The results represent mean values ± S.D. of three independent experiments performed in duplicates (the cells) or the mean values ± S.D. of five independent experiments performed in monoplicates (exosomes). They are expressed as a ratio (in %) of values obtained in transformed (HBEC-12KT-B1) vs. non-transformed (HBEC-12KT) cells. The symbols ‘*’ and ‘**’ denote significant difference (p < 0.05 and p < 0.01, respectively).

