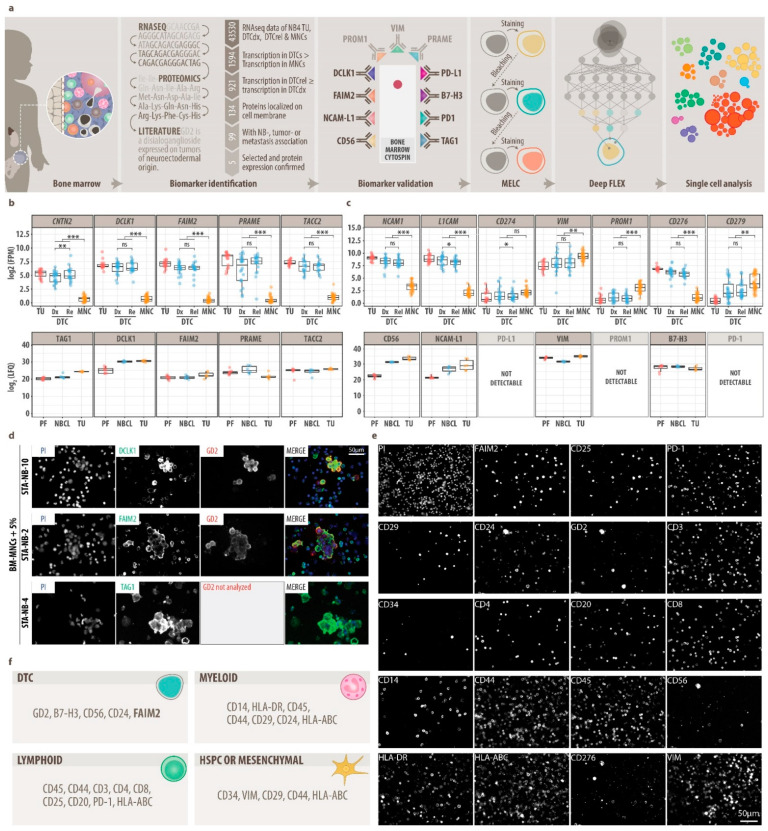
Figure 1.
Data mining and establishment of a multiplex imaging panel (MELC). (a), Flow chart of experimental approach. (b), five potential disseminated tumor cell (DTC) biomarkers identified by data mining of RNA-seq data, proteomics data (LC-MS/MS) and literature. Top: mRNA transcription (RNA-seq) in neuroblastoma primary tumors (TU), diagnostic (dx) and relapse (rel) DTCs and bone marrow-derived mononuclear cells (BM-MNCs). DESeq2, FDR-adjusted p value: ns, p > 0.05, *, p ≤ 0.05; **, p ≤ 0.01; ***, p ≤ 0.001. Bottom: Protein expression in NB peripheral-nerve-associated fibroblasts (PF), neuroblastoma cells lines and TU samples. LFQ, Label-Free Quantification; FPM, fragments per million. (c), Extension of potential DTC biomarkers by immune checkpoint molecules (PD-L1, PD-1, B7-H3), mesenchymal-type neuroblastoma cell markers (VIM, PROM1), therapeutic target NCAM-L1 and diagnostic neuroblastoma marker CD56. DESeq2, FDR-adjusted p value: ns, p > 0.05, *, p ≤ 0.05; **, p ≤ 0.01; ***, p ≤ 0.001. (d), Representative MELC images of newly identified DTC biomarkers DCLK1, FAIM2 and TAG1 on separate samples stained by MELC. Top: DCLK1 (green) and GD2 (red) on BM-MNCs and neuroblastoma cells line STA-NB-10 (mixed 20:1); center: FAIM2 (green) and GD2 (red) on BM-MNCs and neuroblastoma cell line STA-NB-2 (20:1), bottom: TAG1 (green) on peripheral blood-derived MNCs and neuroblastoma cell line STA-NB-4 (20:1) stimulated with IFNγ and anti-CD3/28 beads. Nuclei were counterstained with DAPI (blue). (e), Representative MELC images of our single-cell 20-plex panel on one patient bone marrow sample. (f), Single-cell 20-plex panel composed of DTC, myeloid, lymphoid, mesenchymal and HSPC (hematopoietic stem and progenitor cell) markers.

