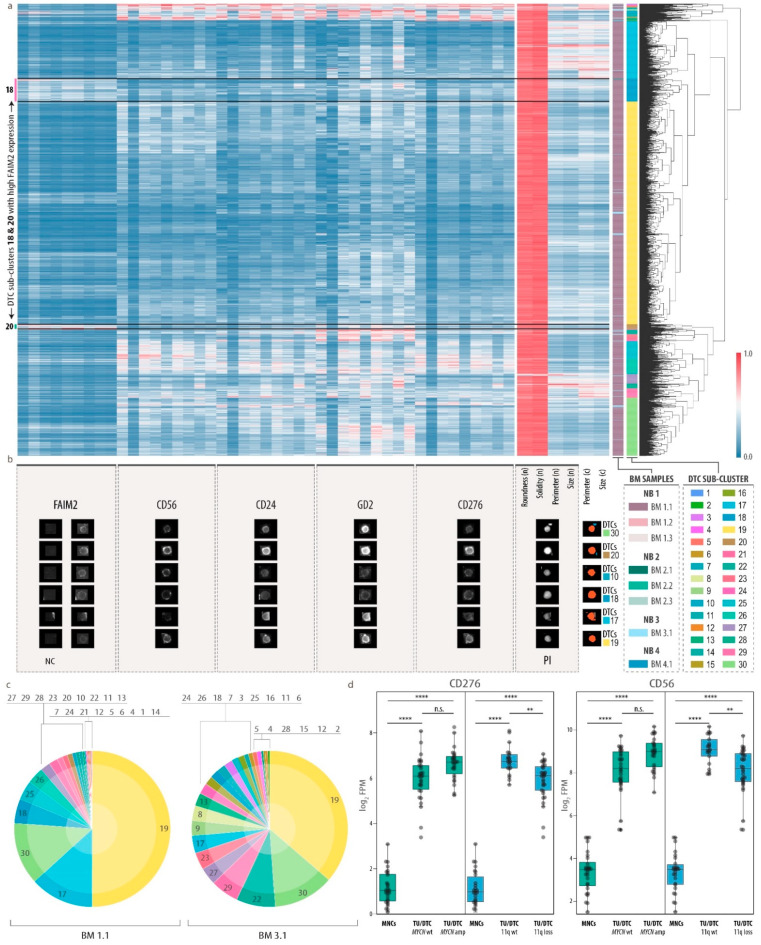
Figure 4.
Characterization of DTC heterogeneity and qualification of FAIM2 as a novel complementary biomarker. (a), Cluster map (hierarchical clustering by Voorhees) showing normalized single-cell feature values of DTCs. n, nucleus; c, cell. Nine columns per marker represent, from right to left, mean intensity, total intensity and mean of the highest 20% of pixel values in the (I) nucleus, (II) cell and (III) cytoplasm/membrane. Color bar on the right shows 30 sub-clusters. Color bar on the left shows the corresponding bone marrow sample. (b), Representative gallery images of six selected cells from different DTC sub-clusters reflecting DTC heterogeneity. For FAIM2 we introduced negative controls (NC) to be used as background threshold levels during data processing. Hence, for this biomarker, the ratio between right column and left column (NC) represents the true signal. (c), Proportion of 30 DTC sub-clusters in highly tumor-infiltrated bone marrow samples (BM 1.1, BM 3.1). (d), CD56 and CD276 mRNA transcription in bone marrow-derived mononuclear cells (MNCs) and neuroblastoma tumor cells (TU/DTC) without (wt) and with (amp/loss) genetic aberration. Wilcoxon–Mann–Whitney with FDR-corrected p-values: ns, **, p ≤ 0.01; ****, p ≤ 0.0001. FPM, fragments per million; amp, amplification.

