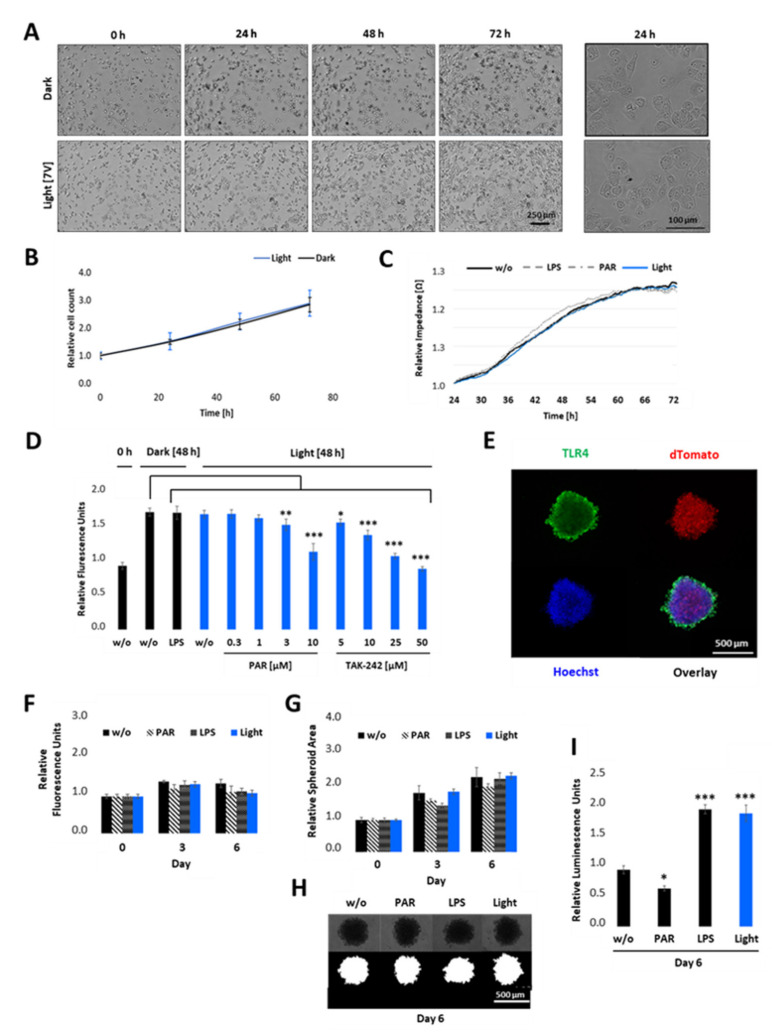
Figure 6.
Cell proliferation and viability of opto-TLR4 PANC-1 upon illumination in 2D cultures and 3D spheroids. (A,B) Opto-TLR4 PANC-1 cell line (3000 cells/ well plate) were either exposed to light for 72 h or kept in the dark. Phase contrast images were taken (A) and cell count (B) was measured every 24 h using the MiniMaxTM 300 Imaging Cytometer. (C) Cells were allowed to attach on ECIS array and 24 h later they were exposed to light, treated with 100 ng/mL LPS or 3 µM PAR, or left untreated for 48 h and changes in impedance measured in real-time. (D) Cells were non-treated, treated with 100 ng/mL LPS, or exposed to light (470 nm) +/− different concentrations of PAR or TAK-242 and cell viability measured 48 h later using PrestoBlue assay. (E) 2000 opto-TLR4 PANC-1 cells were cultured for 4 days as three-dimensional (3D) cell aggregates (spheroids) using non-adherent plates and processed for immunofluorescence microscopy using TLR4 antibody and Hoechst dye. Images were acquired (TLR4-Alexa-488: green, dTomato: red, Hoechst: blue) using a Leica TCS SP8 confocal laser scanning microscope. 5× magnification. Scale bars: 500 μm. (F–I) Spheroids were treated with 100 ng/mL LPS or 3 µM PAR, exposed to light (470 nm) for 7.5 min twice a day, or left untreated for 6 days and (F) cell viability was measured using PrestoBlue assay. (G) Spheroid area was measured on days 0, 3, and 6 by segmenting bright field images (H) using the FIJI Macro INSIDIA. Data were collected at least 3 times in octuplicates and normalised to the non-treated control. (I) Relative NF-κB promoter-linked Gaussia Luciferase activity in opto-TLR4 PANC-1 spheroids on day 6. Post-ANOVA multiple comparisons relative to the control were performed using Dunnett’s test. Error bar = SD. n = 6; * p < 0.05; ** p < 0.01, *** p < 0.001.

