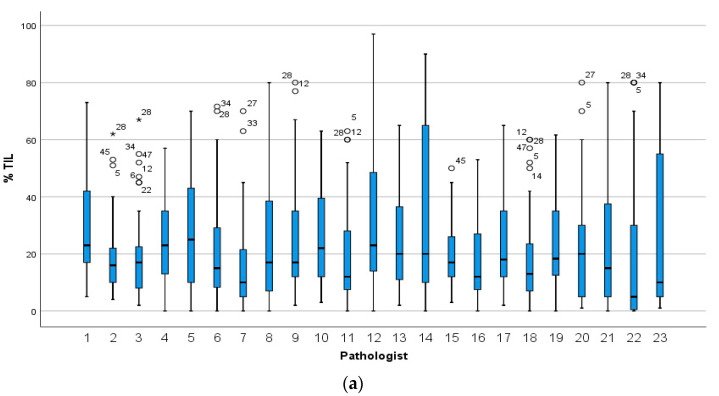
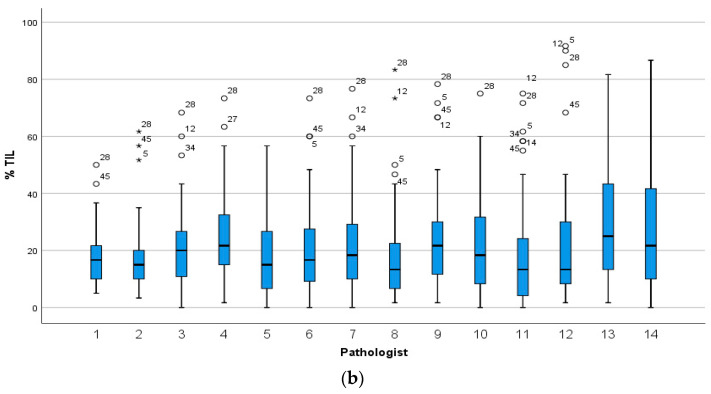
Figure 1.
The distribution of sTILs scores for the 49 cases given by (a) 23 pathologists in circulation 1 and (b) the 14 pathologists in circulation 2. Pathologists are numbered on the x-axis and those who completed both circulations are assigned the same number in circulation 1 and 2. Stars and circles are outliers which lie abnormally far from the other values in the dataset. A circle denotes a value which is either greater than 3rd quartile plus 1.5× interquartile range or is less than 1st quartile minus 1.5× interquartile range. A star denotes an extreme outlier value, which is either greater than 3rd quartile plus 3× interquartile range or is less than 1st quartile minus 3× interquartile range. The number beside the stars and circles is the TNBC slide and case number for that outlier. There was more variation in scoring when each pathologist selected the tumour area to score (a) compared to when each pathologist scored the same FOV (b).


