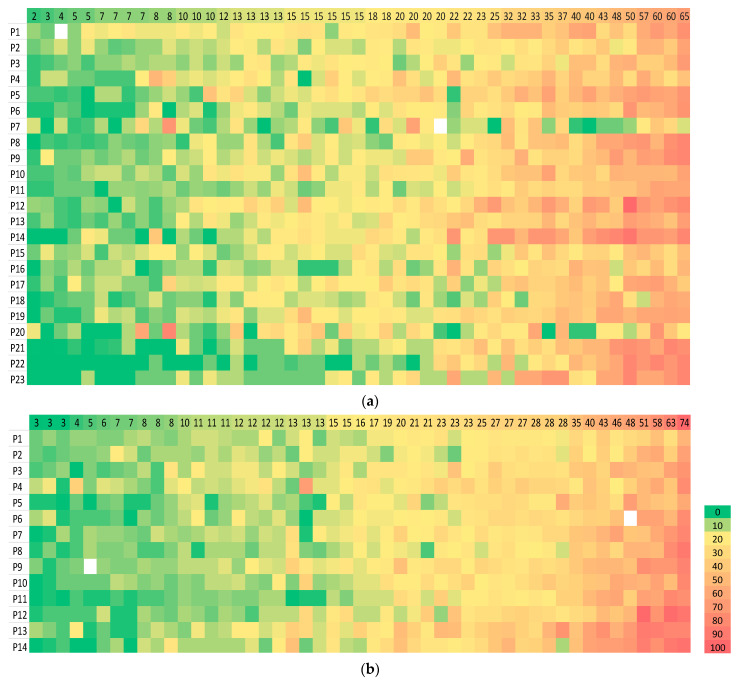
Figure 2.
Heatmap of sTILs scores given by pathologists for 49 TNBC cases. A visual representation of sTILs scores in which each row represents a pathologist (numbered as in Figure 1) and each column a case for (a) Circulation 1 and (b) Circulation 2. The colour of each cell represents the sTILs score for the case, increasing from low (green) to high (orange), as denoted in the separate vertical key; missing data are white. The value given in each cell in the top row of each heat map is the median sTILs score for that case in the respective circulation, and the cases are ordered left to right from the lowest to the highest median sTILs score. Outlier scores for a case relative to others appear as mismatches of colour e.g., green cells within a zone of orange. There is more heterogeneity of scores in circulation 1 compared to circulation 2 and the scores given by pathologists 7 and 20 in circulation 1 diverge considerably from others, whereas the scores given by pathologist 7 in circulation 2 align with those of other pathologists. In circulation 2, the scoring pattern of pathologists 4 and 13 appear to diverge from that of others.

