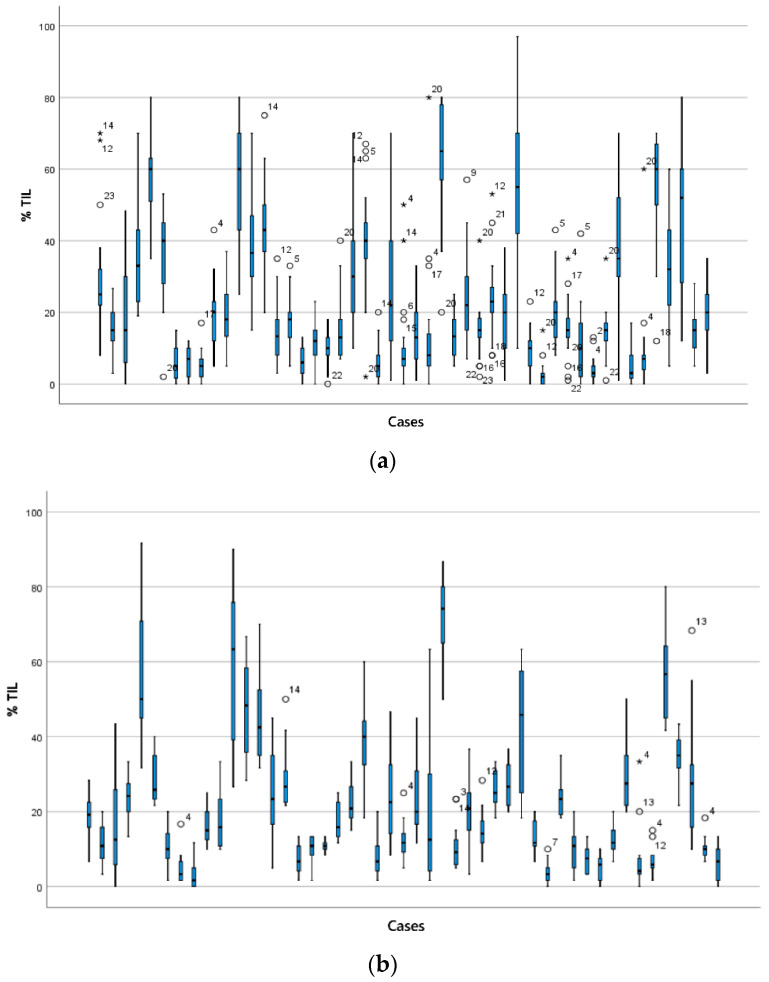
Figure 3.
sTILs scores for TNBCs. The range of sTILs scores is shown for the 49 cases in (a) circulation 1 and (b) circulation 2. Cases are displayed from case 1 (left) to 49 (right) on the x-axis in (a,b). Stars and circles are outlier values which lie abnormally far from the other values in the dataset (as defined for Figure 1). The number beside each star and circle is the number of the pathologist for that outlier. The range of scores is wide for many cases.

