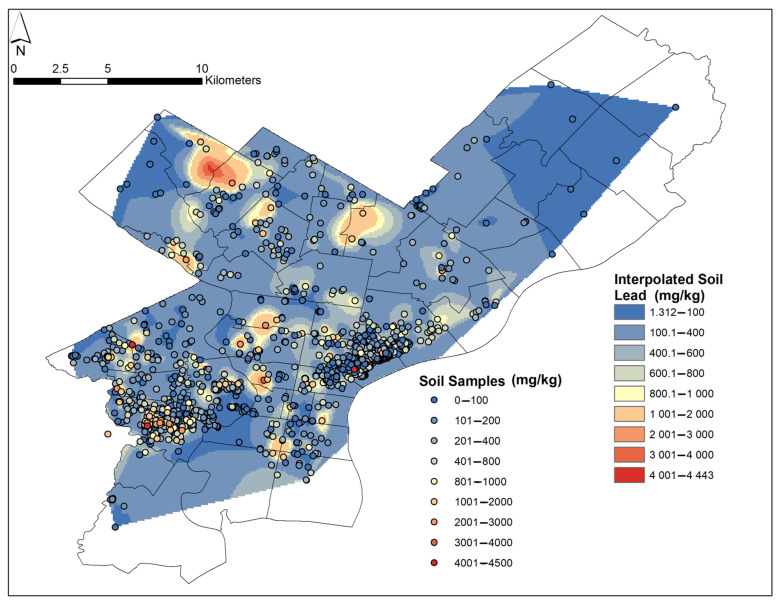
Figure 3.
Map of Philadelphia showing all 2665 samples sites with dots showing measured Pb-in-soil content (colored dots). These dots as well as the background layer, which shows interpolated Pb-in-soil content, are color-coded according to Pb content. In the white/blank areas, no samples have been collected, and therefore, we could not provide interpolated Pb-in-soil content there.

