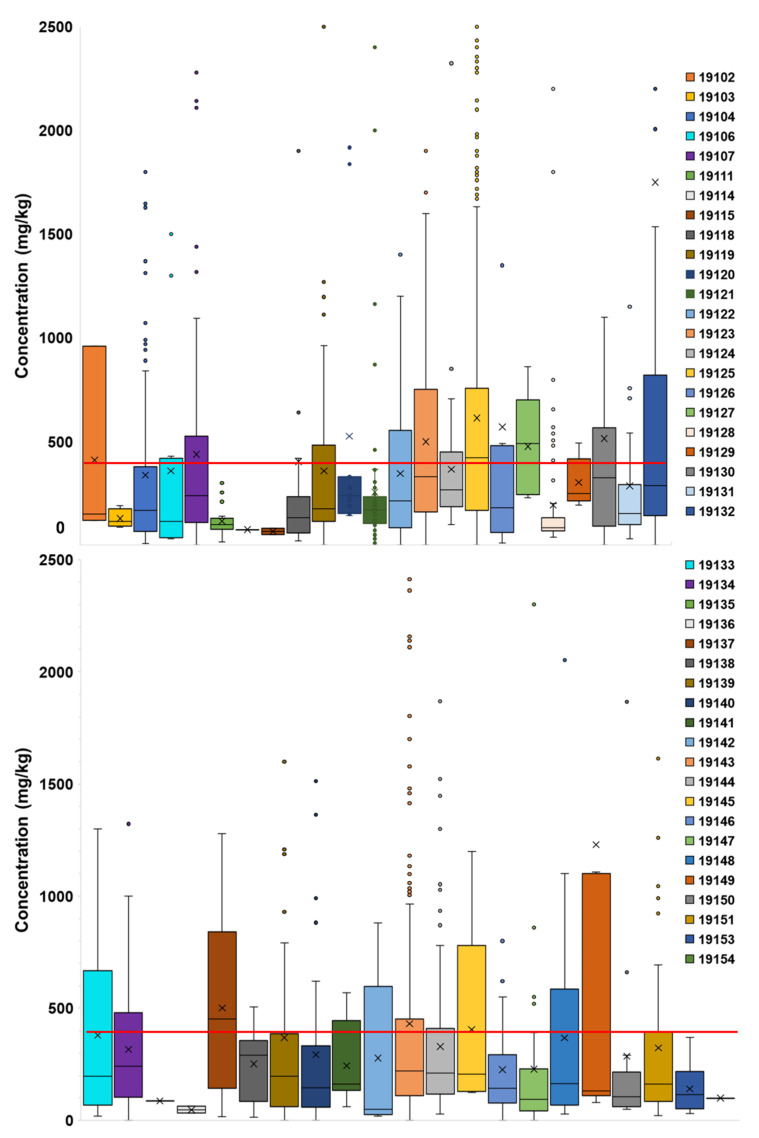
Figure 5.
Box and whiskers plots of measured Pb-in-soil contents by ZIP codes in Philadelphia. The box shows the 25–75th percentile, the x is mean content, and the black line is median. Outliers are shown as dots. All graphs were clipped at 2500 mg/kg Pb, excluding outlier points in ZIP codes 19104, 19118, 19125, 19126, 19130, 19131, 19132, 19139, 19143, 19149, and 19151. The red horizontal line denotes the EPA threshold of 400 mg/kg Pb.

