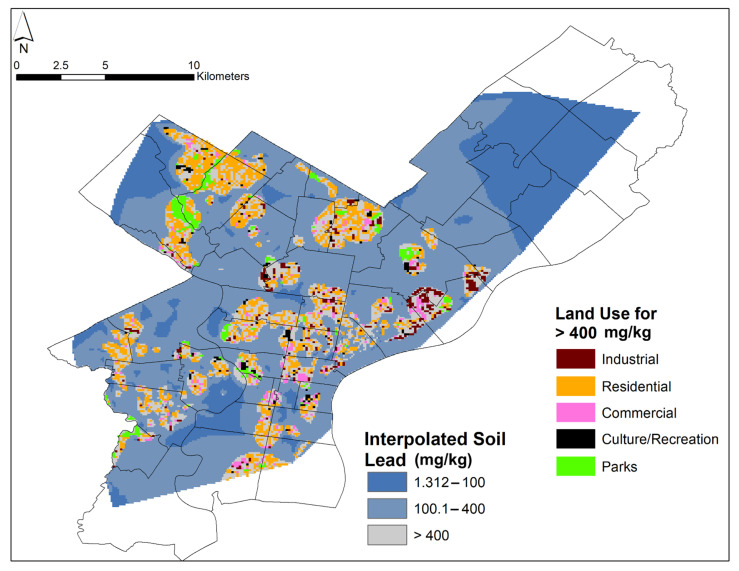
Figure 9.
Map of Philadelphia displaying the interpolated Pb-in-soil contents grouped by land use. Areas with Pb ≥ 400 mg/kg are color-coded for their corresponding land use (industrial, parks, residential, culture/recreation, and commercial). Grey areas with Pb ≥ 400 mg/kg correspond to a type of land use not included in this study.

