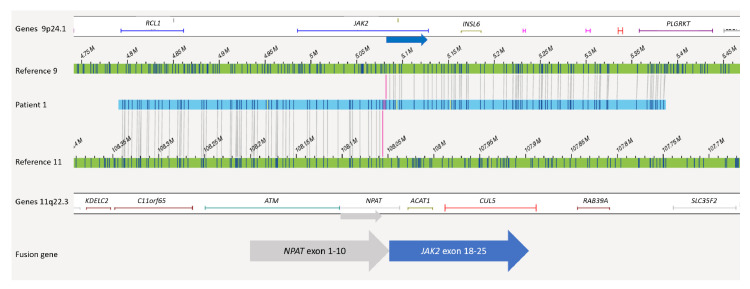
Figure 3.
Balanced translocation t(9;11)(p24.1;q22.3) in patient 1 of OGM. The upper green bar shows the reference map of chr 9 and the lower green bar the reference map of chr 11. Genes located in the depicted regions are indicated above or below. In between, a map of patient 1 (blue) is shown where half of the labels fit to chr 9 and the other half fit to chr 11. Both breakpoints are marked with red lines hitting JAK2 and NPAT.

