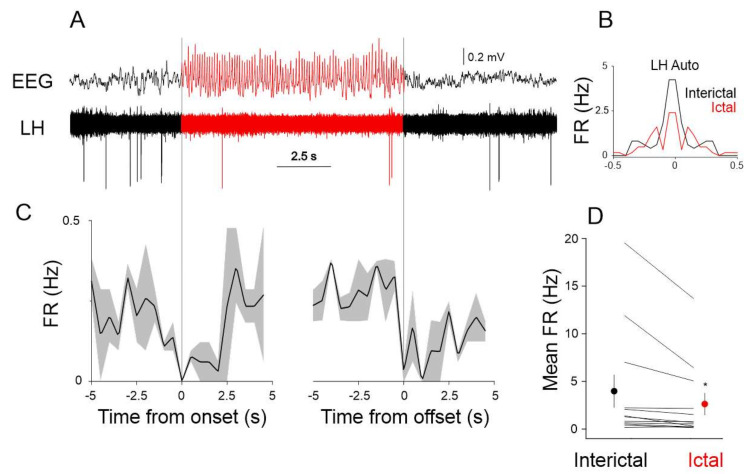
Figure 4.
Ictal and interictal neuronal activity in the LH. (A) Example single unit recording in the LH during ictal (red) and interictal (black) periods. (B) Ictal (red) and interictal (black) autocorrelation of the neuron shown in (A), FR: firing rate. (C) Peri-event histograms of the firing rate of the neuron shown in (A) triggered by the onset (left) and offset of SWDs (see dotted gray lines). Solid lines represent the mean, gray shaded area: s.e.m. (D) Mean ictal and interictal firing rates of all the recorded LH neurons (n = 12). Each line represents a neuron, population mean shown as red (ictal) and black (interictal) circles. The asterisk denotes statistical significance.

