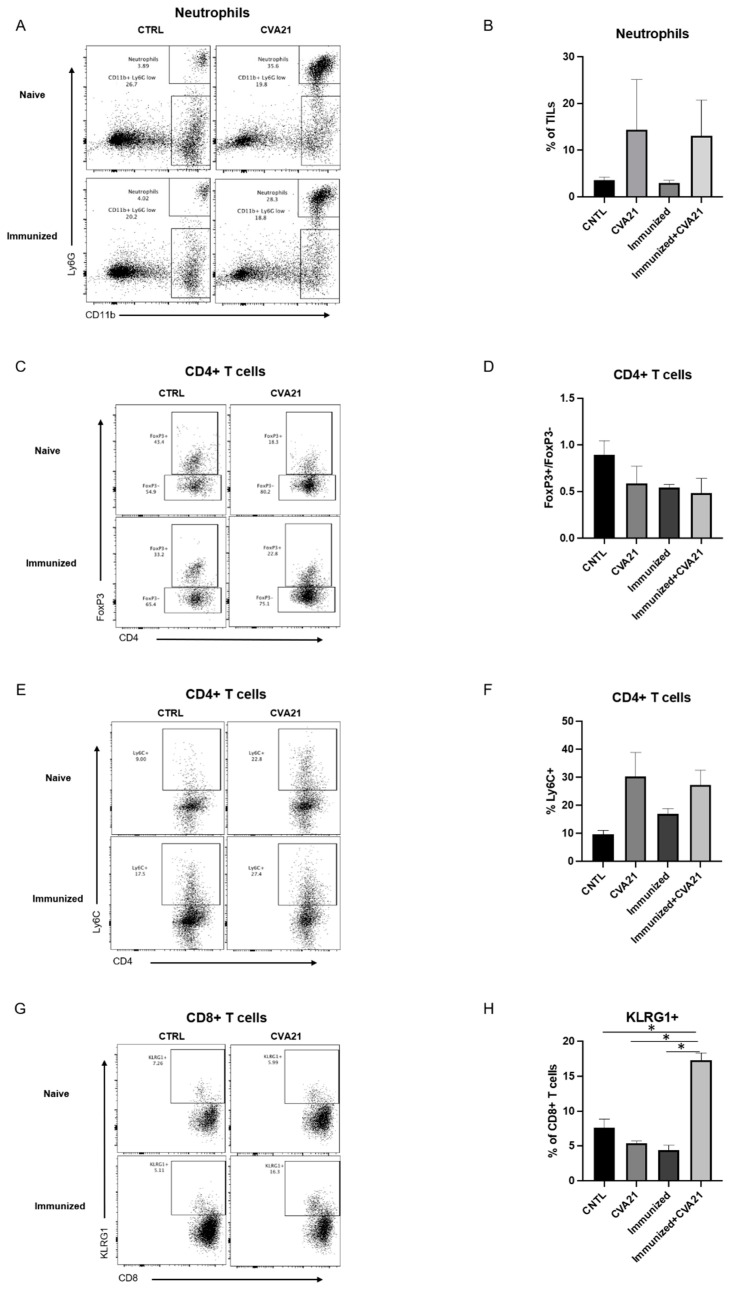
Figure 5.
Tumor immune cell profiling by flow cytometry in naïve and immunized mice. Cells were extracted from tumors treated with saline or CVA21 in naïve or immunized (i) mice. Ly6G and CD11b were used as markers of neutrophils (A,B). FoxP3, Ly6C, and KLRG1 were used to evaluate T cell activation (C–H). Density plots and quantitation are shown for neutrophils (A,B), CD4+ T-cells (C–F), and CD8+ T-cells (G,H). Data were collected from 3 naïve and 3 immunized mice per treatment group. Error bars represent the standard error of the mean (SEM) between the replicates. p values < 0.05 were considered significant (p < 0.05 *).

