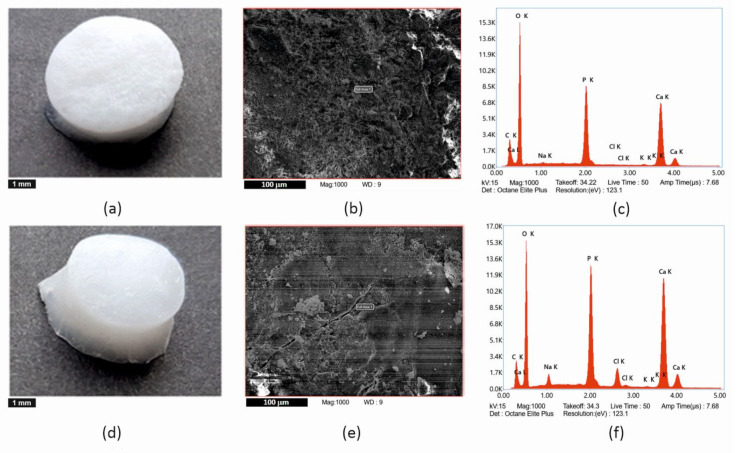
Figure 4.
Comparison of (a–c) samples with HAp prepared by ultrasonication and (d–f) samples with HAp incorporated by in situ synthesis. (a,d) macroscopic image of the scaffolds–scale bar is 1 mm, (b,e) scanning electron microscopy images of calcinated scaffolds–scale bar is 100 µm, (c,f) spectrum of elements—EDX analysis.

