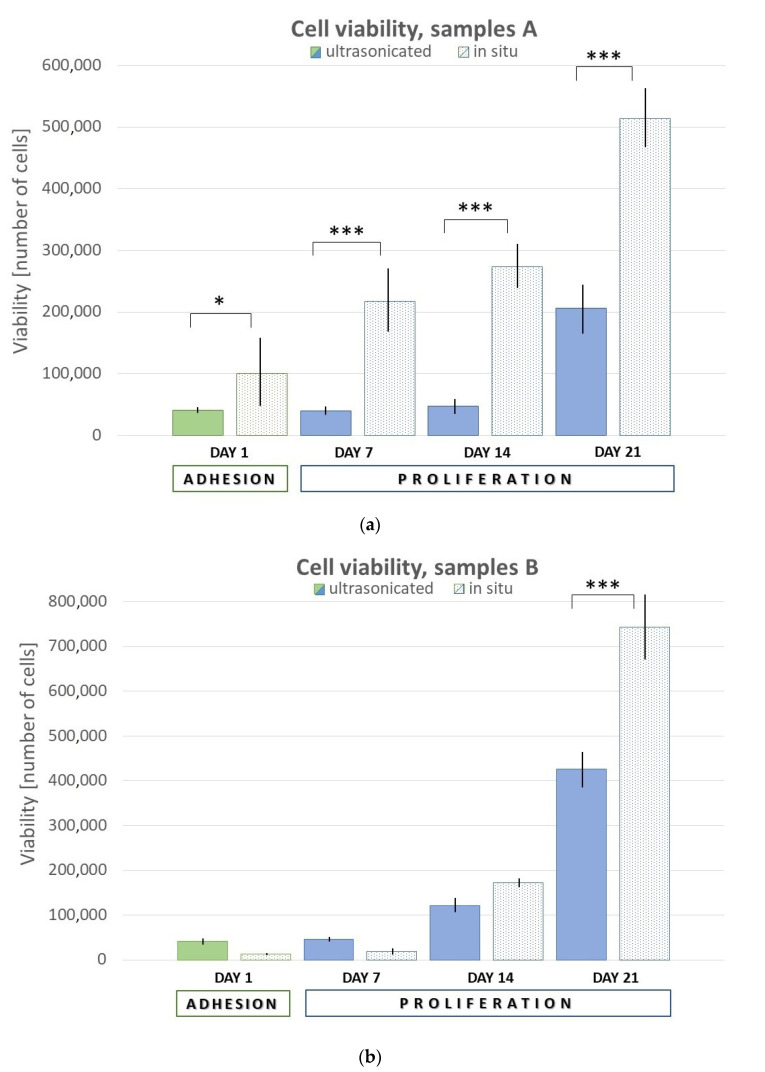
Figure 5.
Graphical representation of adhesion and proliferation. (a) Samples UHA, IHA and (b) samples UHB, IHB. Error bars represent ±SD. Samples A—PVA/HA/HAp = 3:1:2, Samples B—PVA/HA/HAp = 1:1:2; U—ultrasonicated; I—in situ. Asterisks (*, ***) indicate statistically significant differences of p < 0.05 and p < 0.001, respectively.

