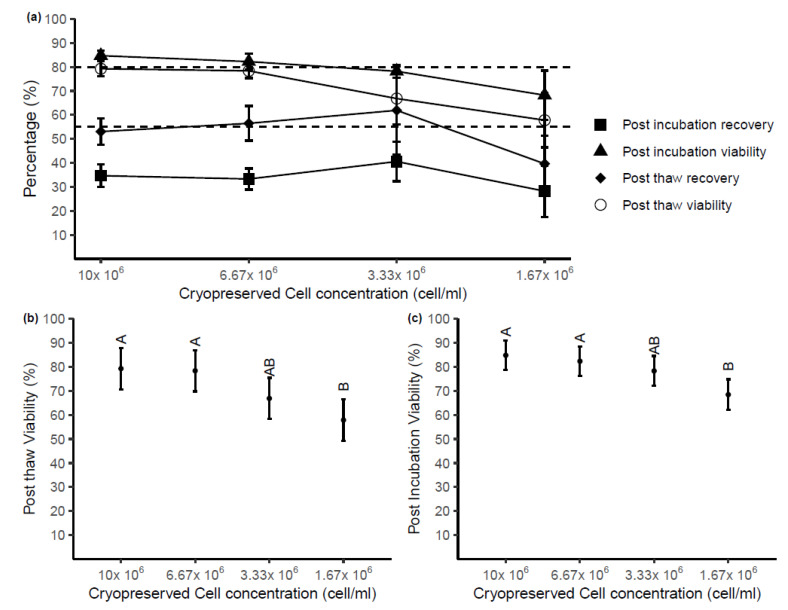
Figure 4.
(a) Post-thaw and post-incubation viability and recovery from samples stored at decreasing cell concentrations in 150 µL of cryopreservation media. Each point represents the mean of raw data with SD (n = 4). Acceptable criteria: Post-thaw viability ≥80%, post-thaw recovery ≥55% (b) The impact of cryopreserved cell concentration on post-thaw viability. Means that are not significantly different in statistical analyses are labeled with the same letter (predicted mean with 95% CI, n = 4). (c) The impact of cryopreserved cell concentration on viability and after overnight incubation at 37 °C (predicted mean with 95% CI, n = 4). Letters (A, B) indicate groups (Tukey’s test), where predicted means that are not significantly are labeled with the same letter.

