Figure 6.
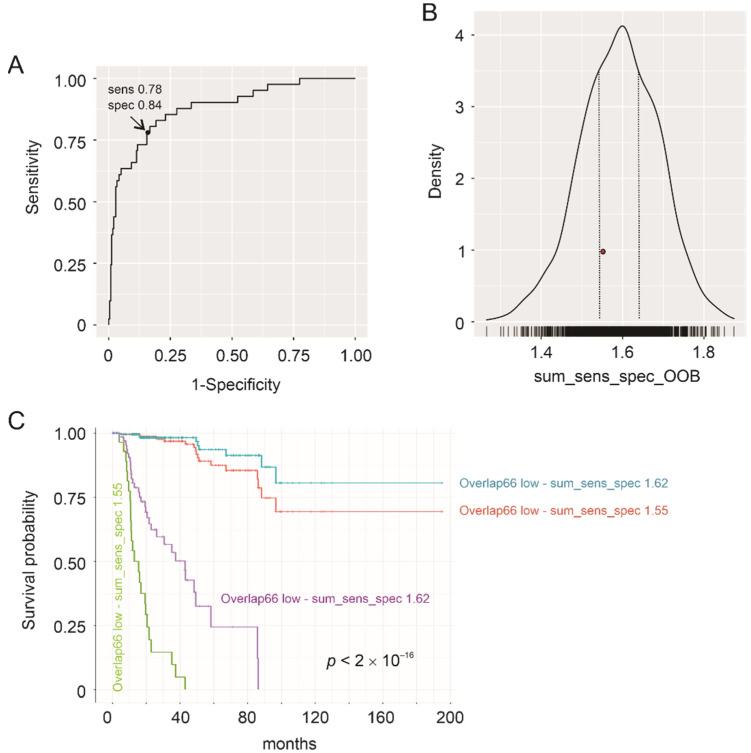
Validation of Overlap66 risk score in stratification of pRCC fatality risk. Cutoff points were estimated using Kernel smoothing method coupled with bootstrapping (n = 1000). The average in-bag and out-of-bag (OOB) bootstrap samples are 63.2% and 36.8% of the full sample size respectively. The analysis was performed using the cutpointr R package (https://github.com/thie1e/cutpointr, accessed on 21 July 2021). (A) ROC curve with the optimal cutoff point indicated (arrow); sens: sensitivity, spec: specificity, and the sum_sens_spec: 1.62. (B) Distribution of out-of-bag (OOB) metric values. The most predictions occur in these OOB samples (n = 1000) at the sum_sens_sepc value 1.6. The region marked by the 2 dotted lines includes a range of sum_sens_sepc values that frequently stratify the fatality risk with high accuracy. The red dot represents a sum_sens_sepc value 1.55. (C) Classification of pRCC tumors into a high- and low-risk group using two indicated cutpoints; the sum_sens_sepc 1.62 cutoff point was obtained using Kernel method and the sum_sens_sepc 1.55 cutoff point (see the red dot in panel (B)) was derived using Maximally selected LogRank statistics (see Figure S9). The p value is for both separations.

