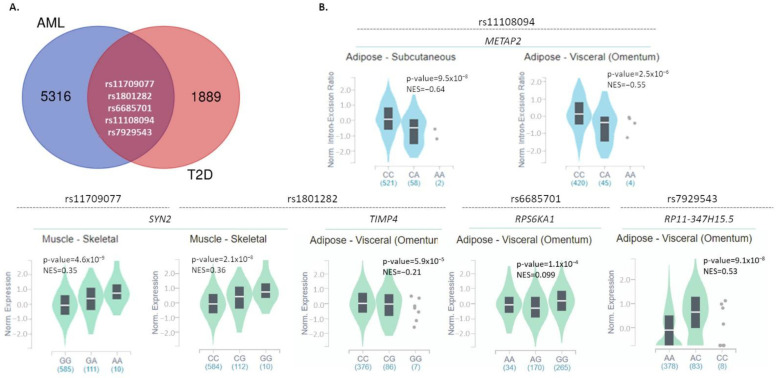
Figure 1.
Common SNPs between AML and T2D and their impact on gene expression in disease-associated tissues. (A) Venn diagrams reporting the number of common and specific SNPs significantly associated with AML or T2D, based on data downloaded from the NHGRI-EBI GWAS Catalog. (B) Violin plots depicting the impact of the five common SNPs on the expression levels of associated or other genes, in disease-associated tissues (subcutaneous or visceral adipose tissue, skeletal muscle, liver, pancreas, whole blood) (GTex portal, May 2021). NES: normalized effect size.

