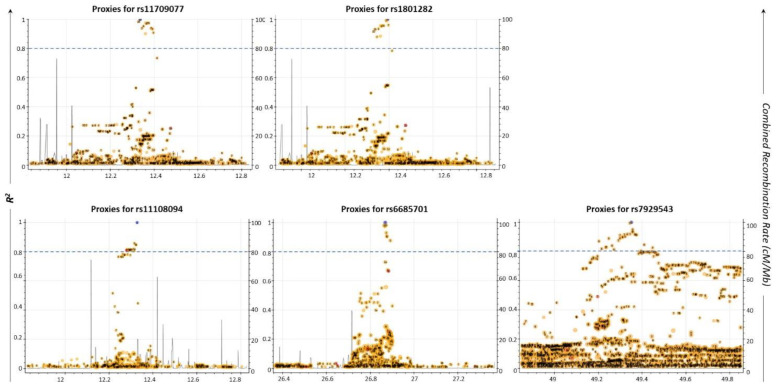
Figure 2.
Regional LD plots of five commonly associated SNPs generated using the LDLink web tool (May 2021). Each dot represents the pairwise LD level between two individual SNPs. X-axis depicts the chromosomal coordinates. Left y-axis represents the pairwise R2 value with the query variant; R2 threshold greater than or equal to 0.8 was considered as a cut-off for selected proxies (blue dashed line). Right y-axis indicates the combined recombination rate (cM/Mb) from HapMap. Recombination rate is the rate at which the association between the two loci is changed. It combines the genetic (cM) and physical positions (Mb) of the marker by an interactive plot.

