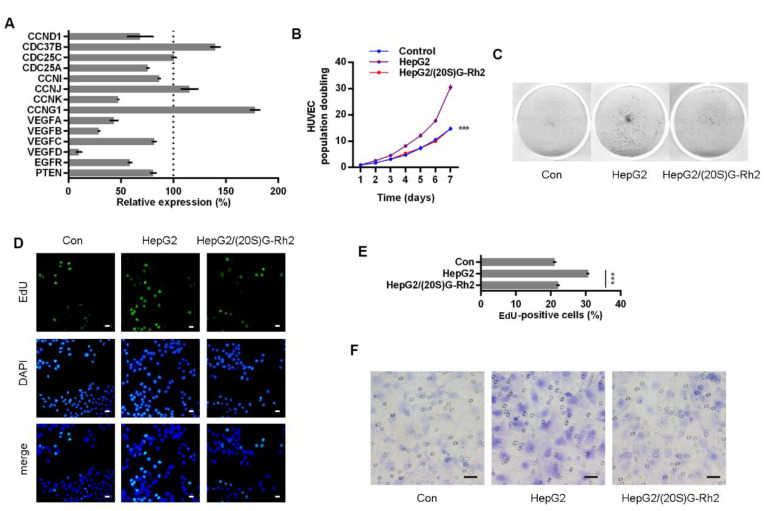
Figure 4.
(20S)G-Rh2 inhibited HepG2 cells induced proliferation and migration of HUVECs. (A) Expression level of STAT3 target genes was determined in (20S)G-Rh2-treated HepG2 cells via qTR-PCR. (B, C) Colony formation of HUVECs were performed with cell-free supernatant from HepG2 cells pre-treated with (20S)G-Rh2 or not. The cell amount of each colony was shown as superimposed symbols with connecting lines (B), and the overall status of colony formation was shown as images after crystal violet staining (C). (D, E) EdU-labeling was utilized for new DNA synthesis detection in HUVECs co-cultured with HepG2 cells. EdU-positive cells were shown as florescent images (D), and EdU-positive ratio was shown as a histogram (E). (F) Migrated HUVECs co-cultured with HepG2 cells were shown as images after crystal violet staining. All experiments were performed with triple replicant. Significance analysis was shown as *** (p < 0.001). Scale bar presented 20 μm.

