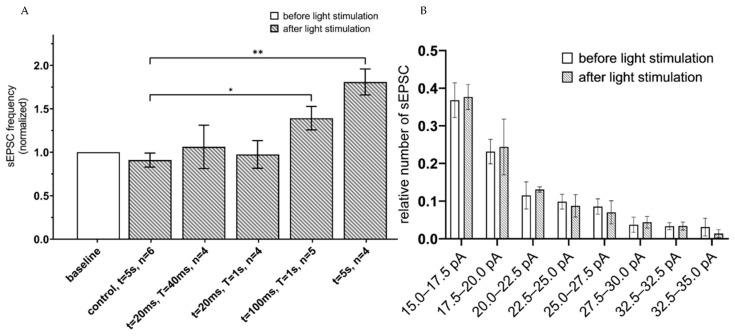
Figure 2.
sEPSC changes in response to astrocyte activation using ChR2(H134R)–mCherry. (A) Values of the normalized frequencies of sEPSC of hippocampal neurons in the CA1 region after light activation (t = 20 ms, T = 20 ms; t = 20 ms, T = 1 s; t = 100 ms, T = 1 s; continuous light t = 5 s) of astrocytes expressing ChR2(H134R)—mCherry. The data are presented as the mean ± SEM, **: p < 0.01, *: p < 0.05. (B) distribution of sEPSC amplitudes before and after optogenetic (t = 5 s) activation of astrocytes expressing ChR2(H134R)—mCherry on the membrane. The data are presented as the mean ± SEM, n = 4.

