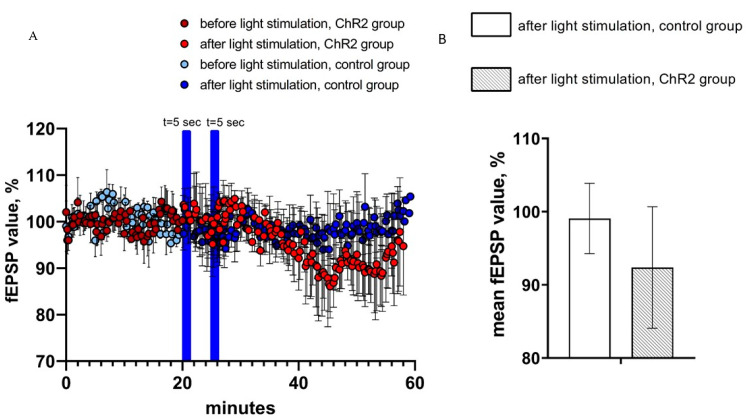
Figure 4.
fEPSP changes in response to astrocyte activation using ChR2(H134R)–mCherry. (A) the normalized values of fEPSP slope (%) before and after light stimulation of astrocytes in the experimental (ChR2 expressing) and control groups. In the figure, the blue bars show the time of continuous light stimulation. (B) Average value of the normalized fEPSP value (%) after light stimulation (2 pulses t = 5 s) in the control and experimental groups, n = 4 for control measurements, n = 3 in the experimental group. The data are presented as an average ± SEM.

