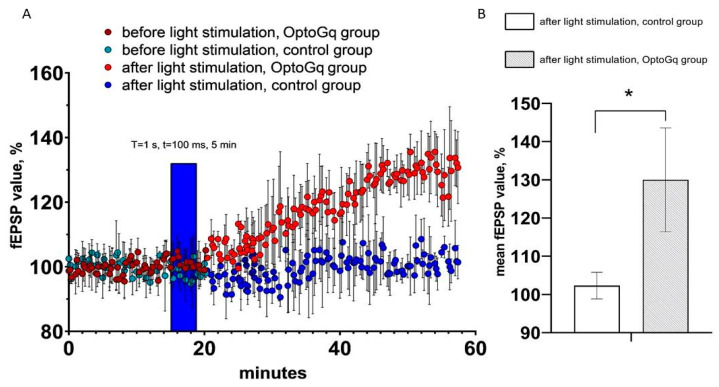
Figure 5.
fEPSP changes in response to astrocyte activation using Opto-a1AR-EYFP. (A) Normalized value of slope (%) before and after light stimulation of astrocytes in the control and experimental (Opto-a1AR expressing) groups of mice. In the figure, the blue bar marks the timing of light stimulation. (B) Average value of the normalized slope value after light stimulation (T = 1s, t = 100ms) in the control and experimental groups mice, n = 3 for control measurements, n = 3 in the experimental group. The data are presented as an average ± SEM, *: p < 0.05.

