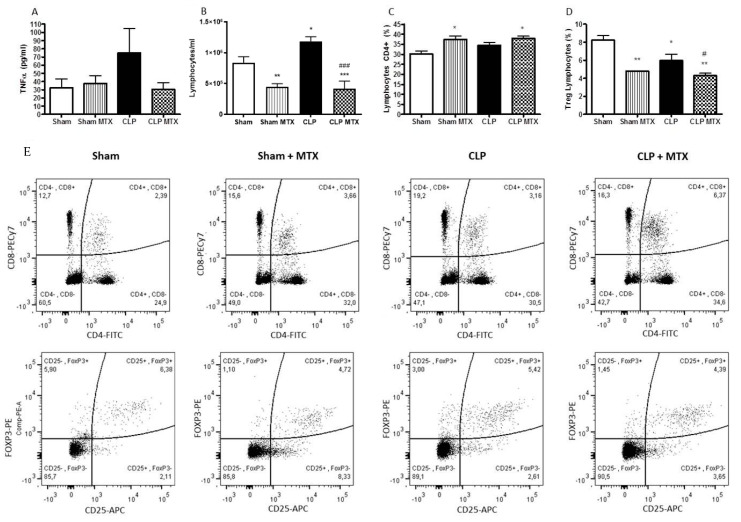
Figure 2.
Systemic inflammation and blood lymphocytes activation. (A) Concentration of TNF-α in plasma measured by ELISA. (B) Number of total lymphocytes from blood cells. (C) Percentage of lymphocytes expressing CD4. (D) Proportion of CD4+ lymphocytes with a Treg phenotype (CD25+FoxP3+). (E) Representative flow cytometry dot plots of all groups. Gattering of CD4+ lymphocytes and Treg phenotype lymphocytes (CD25+FoxP3+). Data is expressed as mean ± SEM. Sham and Sham + MTX n = 4; CLP and CLP + MTX n = 6. * p < 0.05 vs. Sham group; # p < 0.05 vs. CLP group. ** p < 0.01. ***/### p < 0.001.

