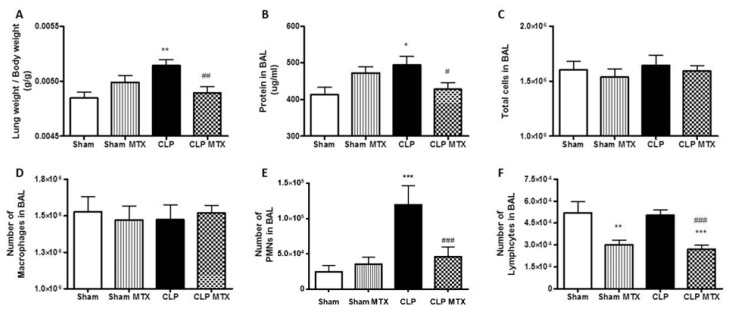
Figure 3.
Lung weight and bronchoalveolar lavage analysis (BAL). (A) Lung weight corrected by the body weight. (B) Concentration of protein in the bronchoalveolar lavage. (C) Number of total cells in the bronchoalveolar lavage. (D) Number of total macrophages in the bronchoalveolar lavage (E) Number of total polymorphonuclear (PMNs) cells in the the bronchoalveolar lavage (F) Number of total lymphocytes in the the bronchoalveolar lavage. Data is expressed as mean ± SEM. Sham and Sham + MTX n = 13; CLP and CLP + MTX n = 18. * p < 0.05 vs. Sham group; # p < 0.05 vs. CLP group. **/## p < 0.01; ***/### p < 0.001.

