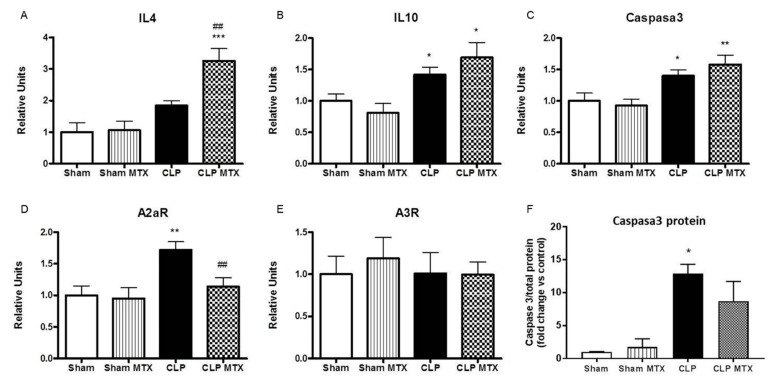
Figure 5.
Gene expression of anti-inflammatory markers, adenosine receptors and caspase 3 and caspase 3 protein in lung tissue. (A–E): mRNA expression by qPCR and (F) Caspase3 protein in lung tissue. Data are expressed mean ± SEM, ∆Ct correction was applied using GAPDH as a housekeeping gene and units are relative to the expression of control group. Sham and Sham + MTX n = 10; CLP and CLP + MTX n = 15. * p < 0.05 vs. Sham group; ## p < 0.01 vs. CLP group. ** p < 0.01; *** p < 0.001.

