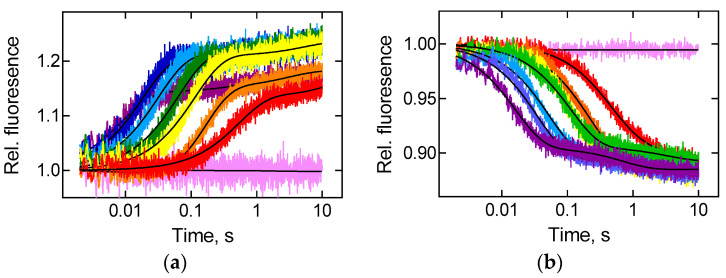
Figure 3.
Temperature dependence of tRNA translocation monitored by two fluorescence labels. Time courses of translocation upon rapid mixing of pretranslocation ribosomal complex (0.06 μM) containing deacylated tRNAMet in the P site and fMet-Phe-tRNAPhe in the A site with EF-G (5 μM) from T. thermophilus at 15 °C (red), 20 °C (orange), 25 °C (yellow), 30 °C (green), 37 °C (blue), 42 °C (dark blue), 50 °C (violet) or with buffer TAKM7 at 20 °C (pink). (a) Fluorescence intensity change upon movement of fMet-Phe-tRNAPhe(Prf16/17) labelled at the elbow region of tRNA. (b) Fluorescence intensity change upon movement of BPY-Met-Phe-tRNAPhe labelled at CCA-end of tRNA. Double-exponential fits are black lines, and numerical values are provided in Figure 4 and Table 1. Each time course reflects the average of 5 to 7 technical replicates. S.e.m. associated with the kinetics were calculated by the GraphPad Prism software.

