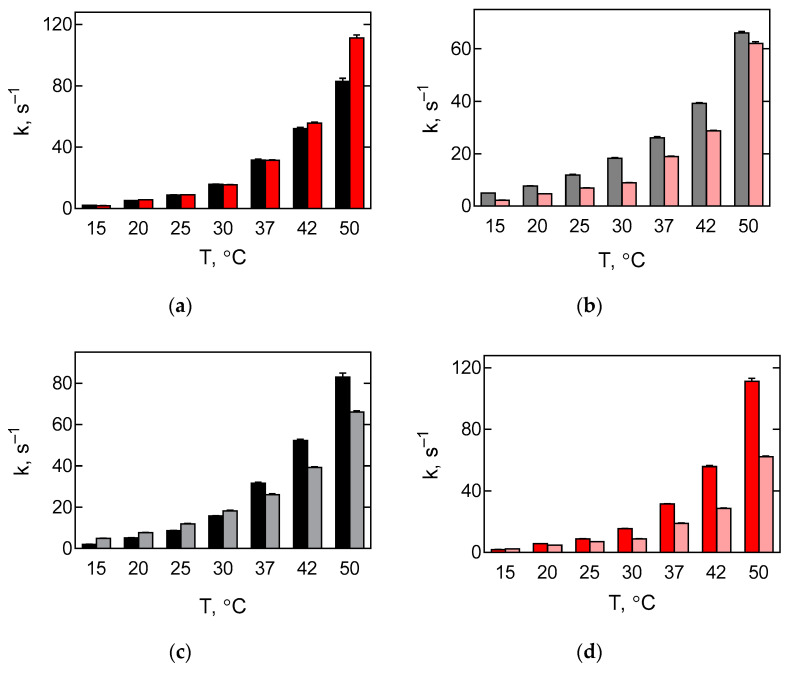
Figure 4.
Comparative analysis of temperature dependence of translocation catalysed by EF-G from E. coli or T. thermophilus. Bar graphs showing rates of translocation (k1 of double-exponential fit, Figure 3 and Table 1). Error bars correspond to respective s.e.m. (a) Rate of translocation induced by EF-G from E. coli (black) or T. thermophilus (red) and detected by the label at the elbow region of tRNA. (b) Rate of translocation induced by EF-G from E. coli (grey) or T. thermophilus (pink) and detected by the label at CCA-end of tRNA. (c) Rate of translocation induced by EF-G from E. coli and detected by the label at the elbow region (black) and CCA-end (grey) of tRNA. (d) Rate of translocation induced by EF-G from T. thermophilus and detected by the label at the elbow region (red) and CCA-end (pink) of tRNA.

