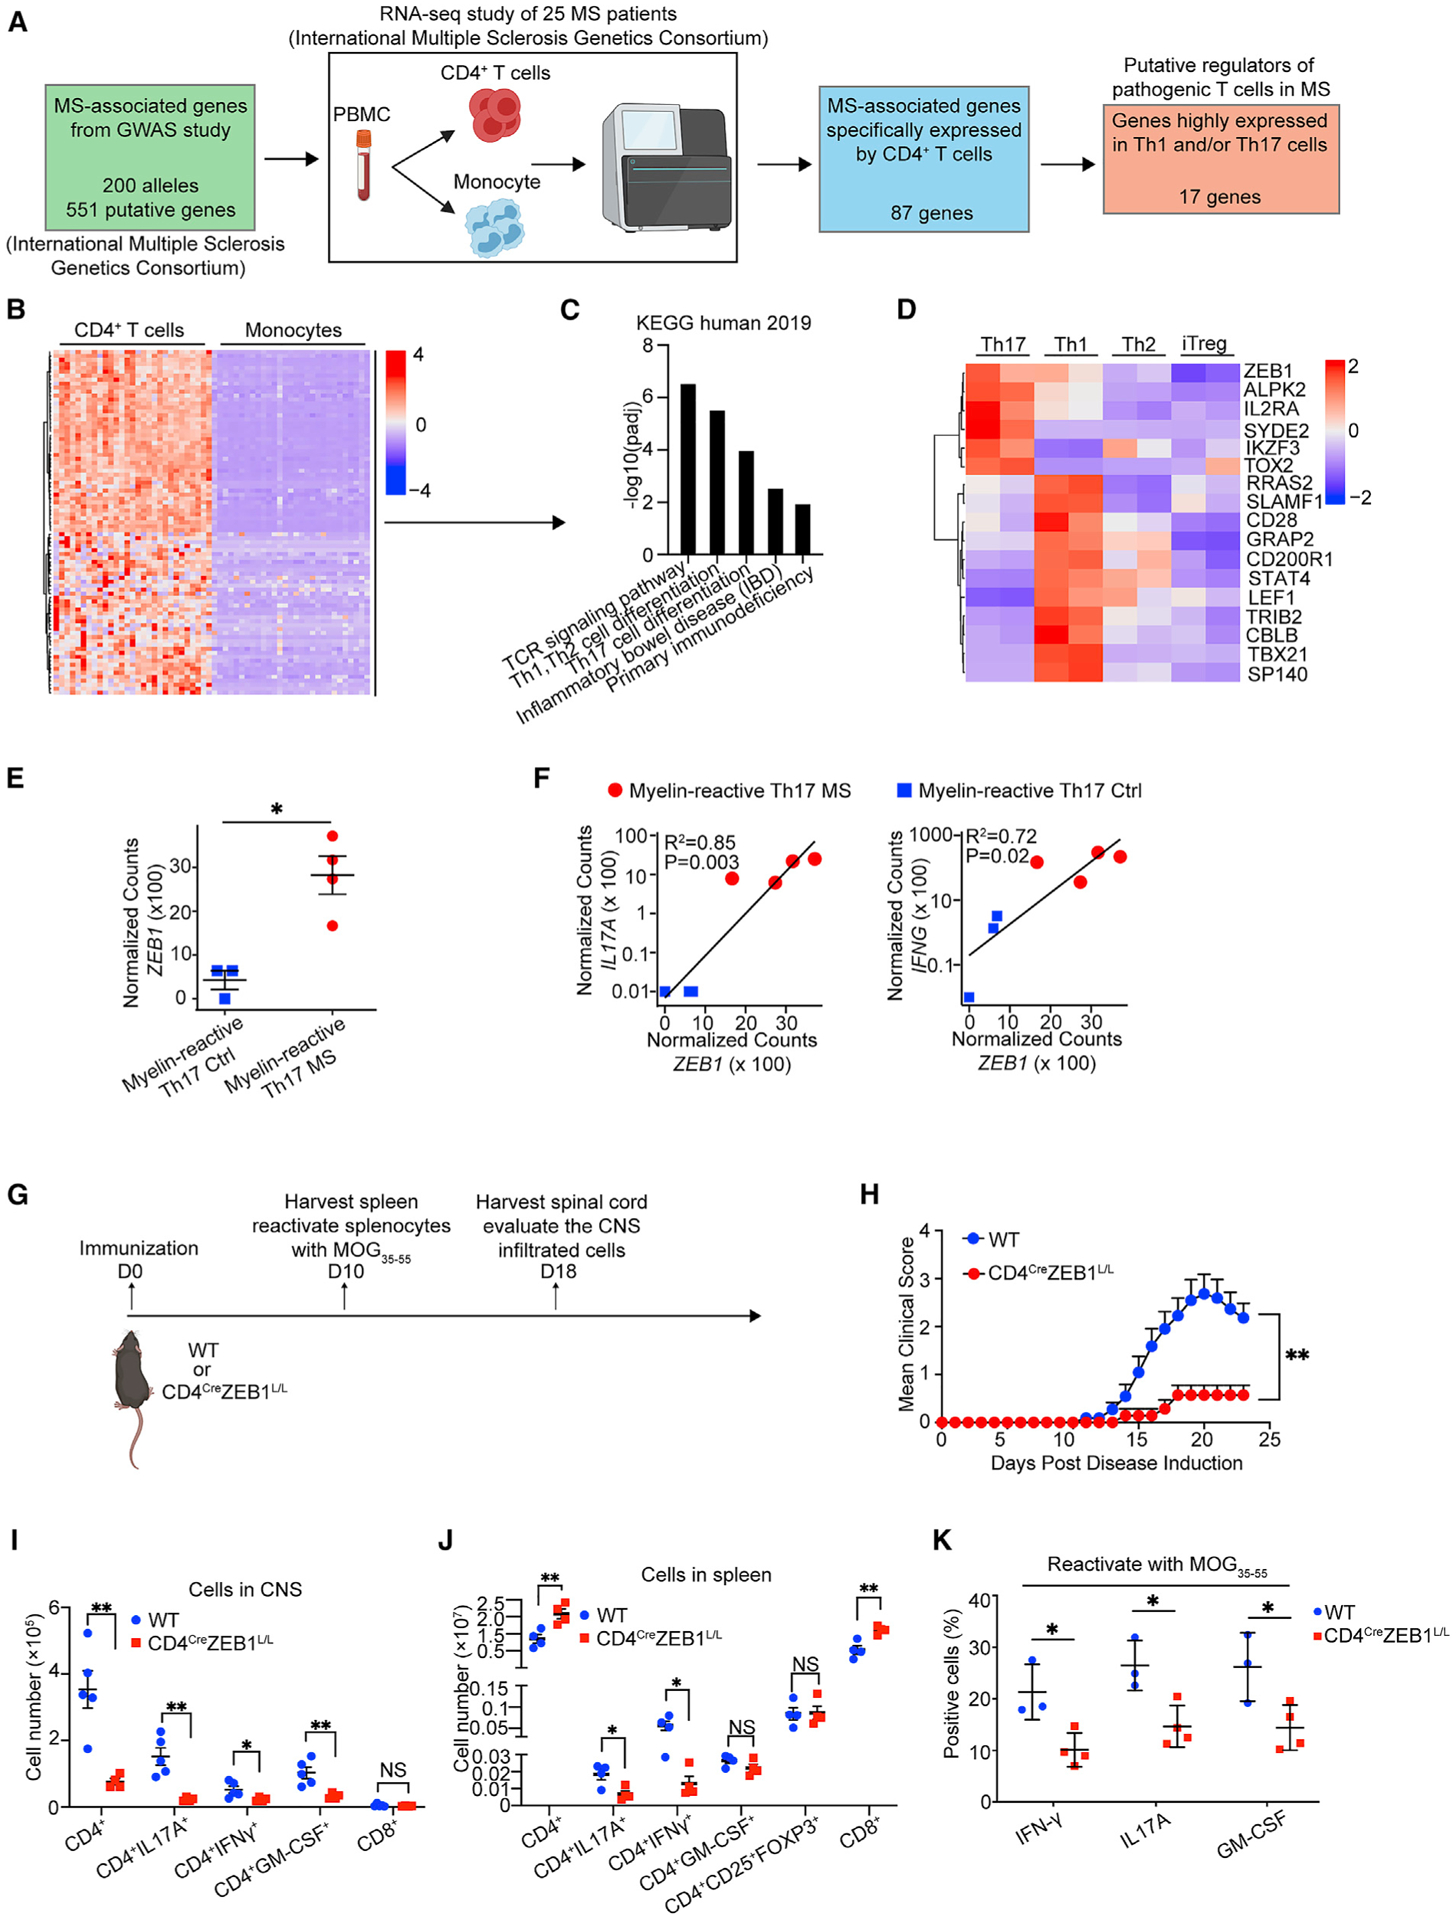
Figure 1. ZEB1 mutations modulate risk for multiple sclerosis and experimental autoimmune encephalitis.

(A) Schematic to identify putative MS-relevant regulators of pathogenic Th1/Th17 differentiation.
(B) Heatmap of MS-associated genes expression in CD4+ T cells and monocytes from MS patients.
(C) Bar plot showing significantly enriched pathways in the genes in (B).
(D) Heatmap of genes highly expressed in Th1 and/or Th17 cells versus Th2 and Treg cells.
(E) Dot plot showing ZEB1 gene expression level in myelin-reactive Th17 cells from MS patients (Th17 MS) and healthy controls (Th17 Ctrl).
(F) Dot plot showing linear correlation of ZEB1 gene expression with IL-17A and IFNG gene expression in myelin-reactive Th17 cells from MS patients (Th17 MS) and healthy controls (Th17 Ctrl).
(G) Schematic displaying the experimental design for experimental autoimmune encephalomyelitis (EAE) model.
(H) Clinical scores of wild-type (WT, n = 11) and CD4CreZEB1L/L (n = 7) mice in EAE. Statistic difference is tested by nonparametric Mann-Whitney test.
(I) Flow cytometry evaluating the number of CD4+ cells, CD4+IL-17A+ cells, CD4+IFN-γ+ cells, CD4+GM-CSF+cells, and CD8+ cells in the CNS of CD4CreZEB1L/L (n = 4) and WT (n = 5) mice at 18 days post immunization.
(J) Flow cytometry evaluating the number of CD4+ cells, CD4+IL-17A+ cells, CD4+IFN-γ+ cells, CD4+GM-CSF+cells, CD4+CD25+FOXP3+ cells, and CD8+ cells in the spleen of CD4CreZEB1L/L (n = 4) and WT (n = 5) mice at 10 days post immunization.
(K) Flow cytometry analysis of cytokine expression in CD4+ T cells from reactivated splenocytes from CD4CreZEB1L/L and WT mice.
The data in (E) and (H)–(K) are presented as the mean ± SEM.
Statistical differences in (F) were tested using Pearson’s correlation coefficient test. All statistical differences in (E) and (I)–(K) were tested using unpaired Student’s t test (two-tailed). *p < 0.05, **p < 0.01.
