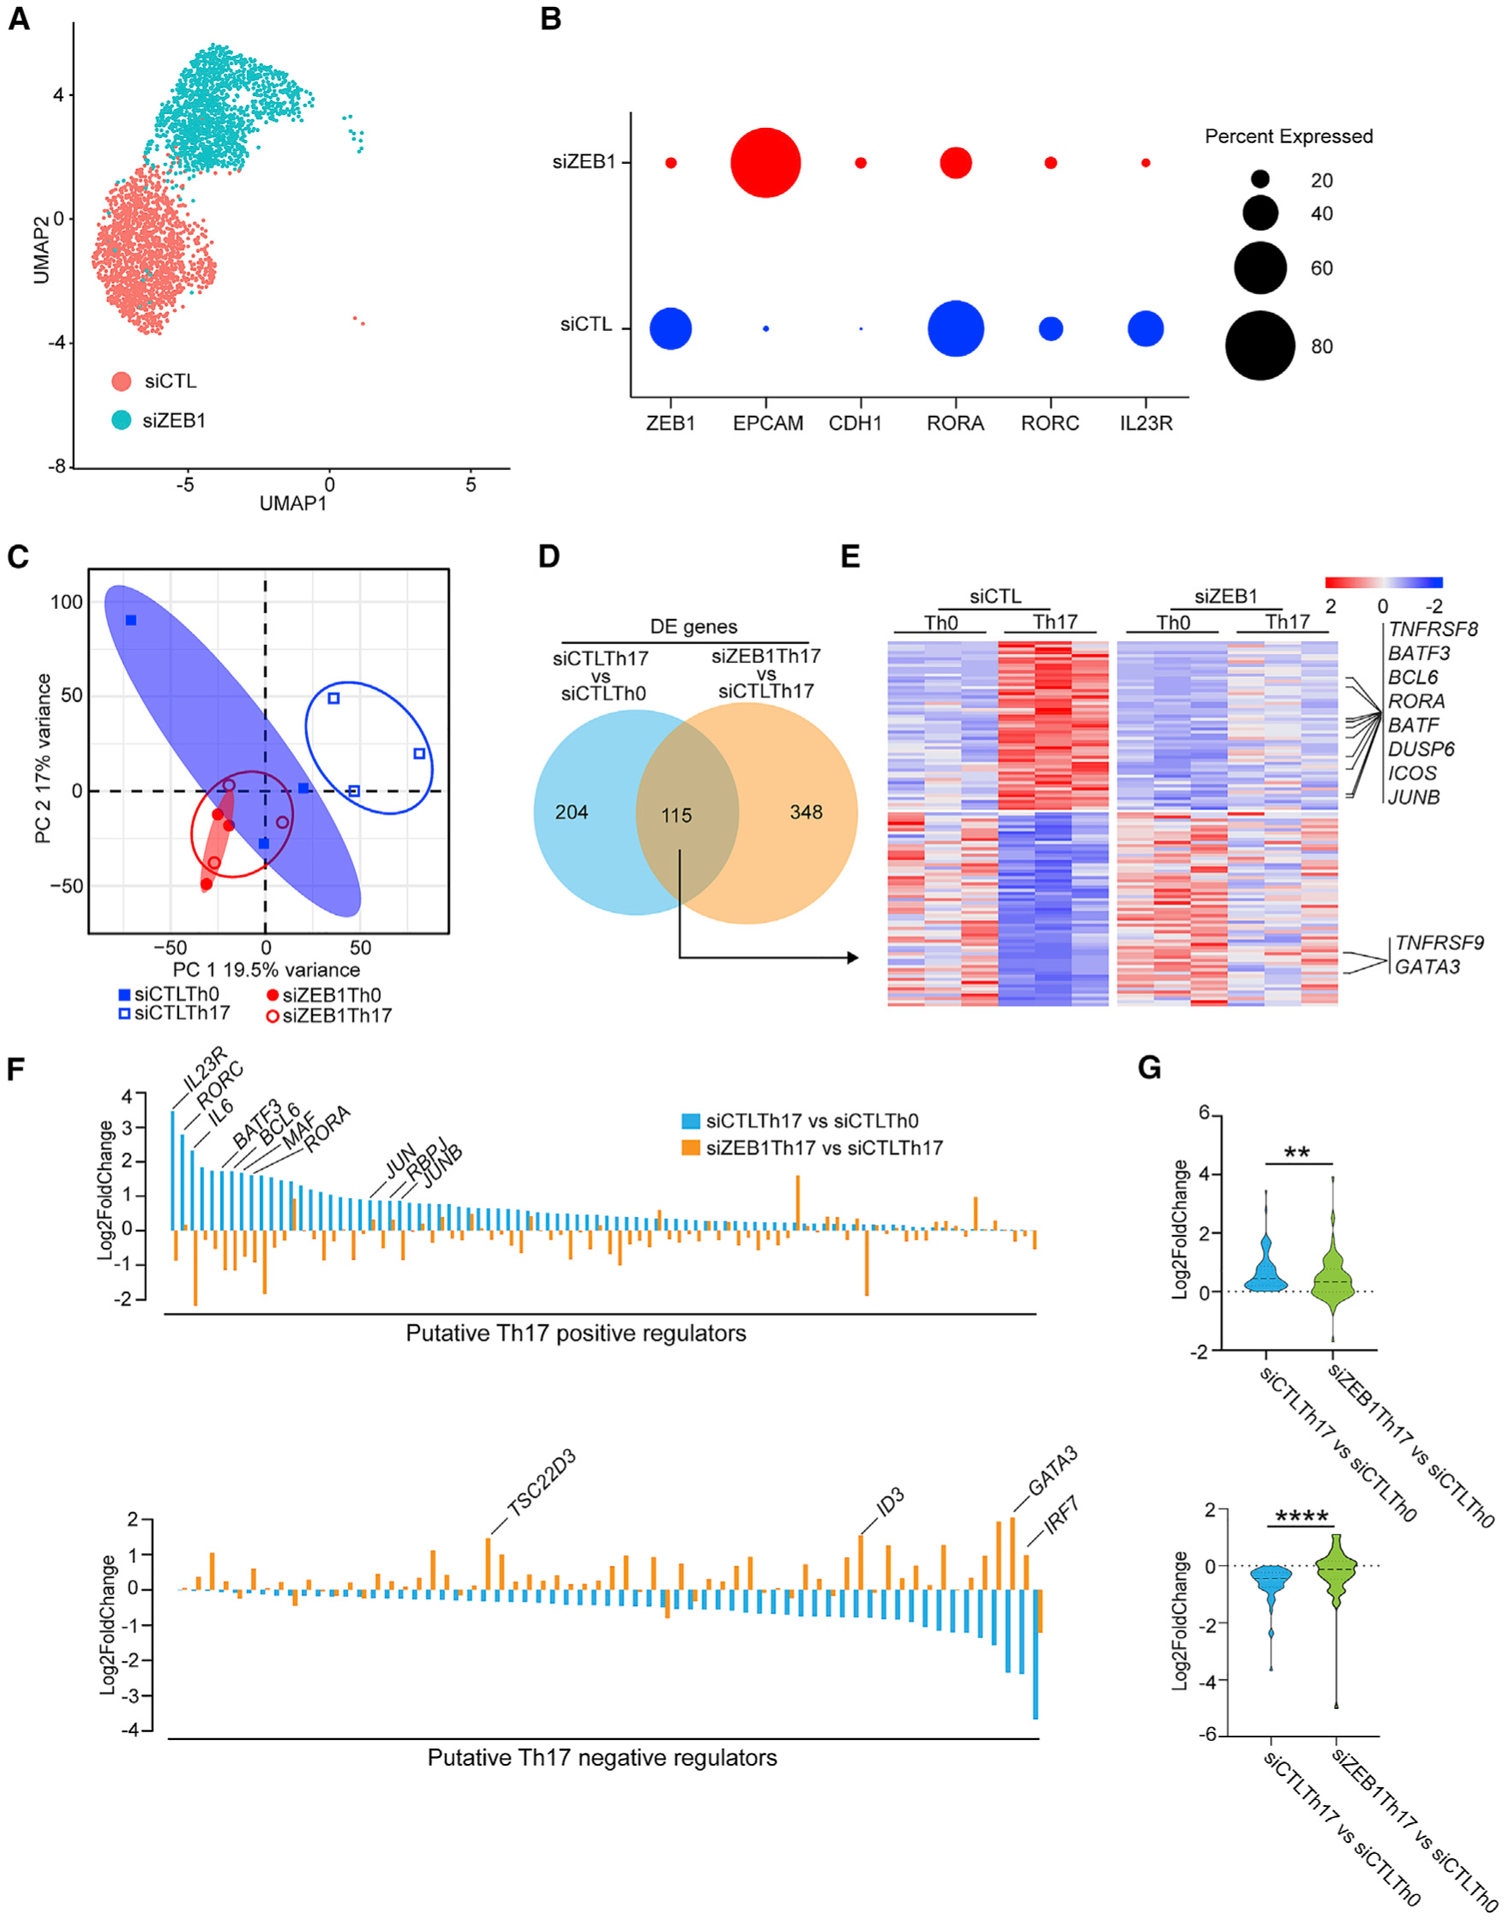
Figure 3. ZEB1 knockdown blocks global acquisition of the Th17 gene expression signature.

(A) Uniform manifold approximation and projection (UMAP) plot representing merged single-cell transcriptomes of siZEB1 Th17 (1699) and siCTL Th17 (1520) cells.
(B) Dot plot depicting selected scRNA-seq marker genes in siCTL and siZEB1 clusters. Dot size represents percentage of cells expressing the gene.
(C) PCA plot of the bulk transcriptomes of Th0 and Th17 cells in siZEB1 and siCTL cohorts (n = 3 independent experiments from 3 different healthy donors).
(D) Venn diagram displaying overlapped genes between differentially expressed (DE) genes in bulk RNA-seq of siCTL Th17 versus siCTL Th0 and siZEB1 Th17 versus siCTL Th17 cells.
(E) Heatmap of genes overlapped in (D).
(F) ZEB1-dependent changes in the expression of putative Th17 regulator genes.
(G) Violin plots of the expression changes between siCTL-treated Th0 cells and siCTL- or siZEB1-treated Th17 cells.
(A and B) Data are from scRNA-seq. (C–G) Data are from bulk RNA-seq.
p values in (D) were calculated using Wald test and adjusted for multiple-hypothesis testing using the Benjamini-Hochberg method. p values in (G) were calculated using paired Student’s t test (two-tailed). **p < 0.01, ****p < 0.0001.
